Interact with this visualization on Tableau Public.
In this video we will explore the Tableau K-Means Clustering algorithm. K-Means Clustering is an effective way to segment your data points into groups when those data points have not explicitly been assigned to groups within your population. Analysts can use clustering to assign customers to different groups for marketing campaigns, or to group transaction items together in order to predict credit card fraud.
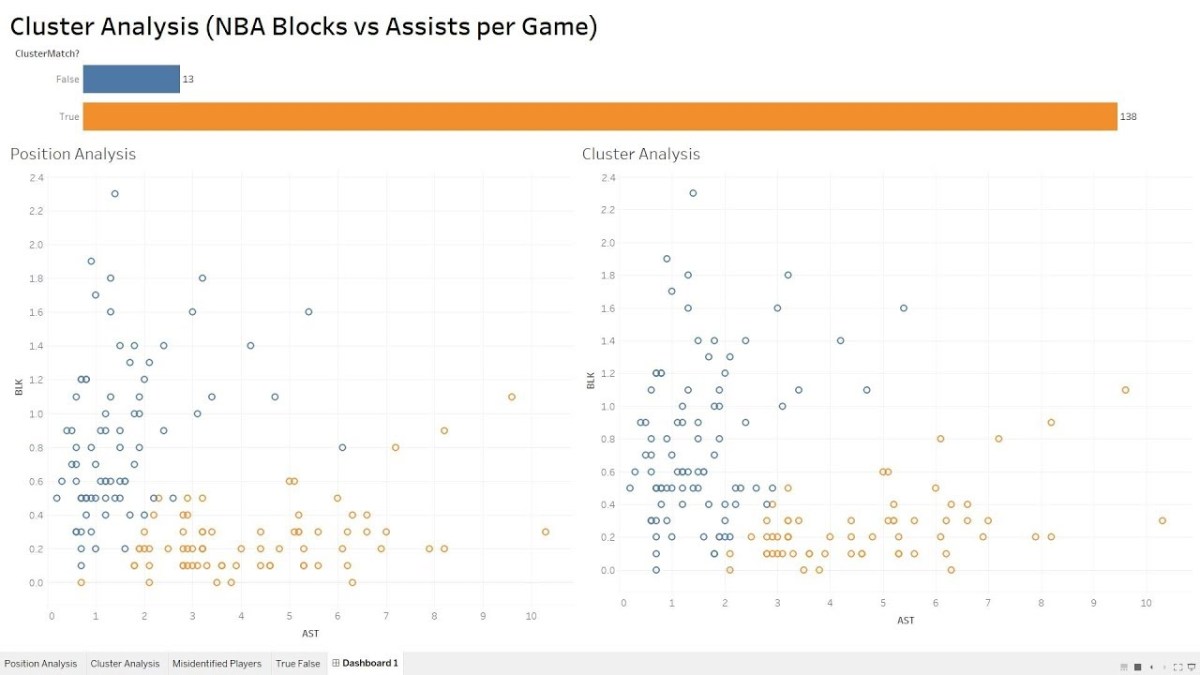
In this analysis, we’ll take a look at the NBA point guard and center positions. Our aim is to determine if Tableau’s clustering algorithm is smart enough to categorize these two distinct positions based upon a player’s number of assists and blocks per game.
Nicola Jokic is a Statistical Unicorn
If you also watch the following video you’ll understand why 6 ft. 11 center Nikola Jokic is mistakenly categorized as a point guard by the algorithm. This big man can drop some dimes!
If you’re interested in Business Intelligence & Tableau subscribe and check out my videos either here on this site or on my Youtube channel.
