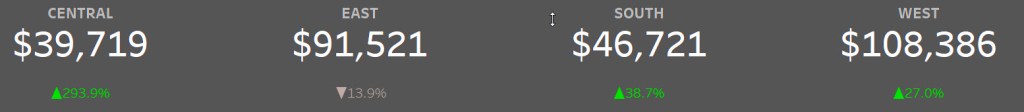
In this video you will learn a quick and easy approach to putting together KPIs that illustrate how profits perform in relation to a budget (i.e., targets vs actuals). Of course the KPIs will be interactive thanks to help from parameters.
Now the dashboard that I built around the KPIs will definitely form the basis of additional videos. There are several techniques here (filtering viz in tooltips, show/hide container, bar in bar chart, reset all filters button, etc.) that form the basis of a good intermediate level dashboard.
Inspiration comes in many forms. I have to give a shoutout to Keith Dykstra for offering his original dashboard for reverse engineering. The idea for the KPIs and bar in bar chart are inspired by Keith. I added additional elements such as the reset all filters button, filtering by states via treemap, parameters in lieu of hover over images.
Shoutout to the Kevin Flerlage for his great PowerPoint button workbook. I modified the on/off toggle button based upon a template from Kevin’s workbook.
Finally, I was watching an Oregon vs UCLA football game one Saturday and was impressed by Oregon’s latest uniform combination. I had to throw that grey and green combination together for use on the dashboard. Inspiration can come from many places! Here’s a little Oregon football and my “Saturday Night Lab” tweet.
I’m Tableau certified and with some study time and focus, you can become Tableau certified as well.
As of this year, I can say that I, Anthony B. Smoak passed the Tableau Desktop Certified Associate exam. I already hold the Certified Business Professional (CBIP) designation which is product agnostic and a great certification for a data consultant and data blogger to showcase (apologies for the humblebrag). Read up on my experiences with that certification here.
Although my Tableau certification aim started as a mere whim, it morphed into a full time goal by the time 2020 rolled around. We all know 2020 has been a challenging year for most of us, I’ve tried to do my best to make it redeemable by continuing to learn and up-skill. And because you’re reading this post, my assumption is you are too! Great minds think alike.
Why did I want to pursue the Tableau Desktop Certified Associate certification?
I run a YouTube Channel and blog focused on data tools; Tableau content is the most salient feature of these passion projects. Becoming Tableau Certified helps convince you that I know what I’m talking about.
Clients respect credibility. I recently delivered a data visualization workshop at a well known Fortune 20 company and being certified as well being a Tableau Public Ambassador helped establish my bona fides.
The more you study, the more you learn. It was refreshing to brush up on some basic functionality and even learn some new intermediate tricks while prepping for the exam.
Just like you, I found myself with a bit more time in 2020 to start acting on neglected data goals. When the world shakes off 2020 (please make it stop) and starts getting back to normal, people will ask ‘How did you better yourself during the downtime’. My answer will be Tableau (and fostering a boxer puppy, but that is for another blog post).
As my exam time came about, I logged in to the testing website and my proctor had me share my license to prove that it was indeed me taking the test. I also had to show that my physical table (not in the Tableau context) was clear of any papers or other materials. Once that was clear it was off to the races. Although you will have 2 hours to complete the exam, make sure to account for at least 30 minutes of setup time before you actually start the test.
Of course I don’t remember exact questions and wouldn’t share any even if I did but I do recall thinking that I had a good handle on most of the material. There were only two questions where I was completely stumped and had to take a guess. The test is timed and by the time I finished answering every question, there was only about 10 minutes left to review my 36 answers.
For some of the more esoteric questions on product minutiae, Google is your friend. The test is mostly open internet which can be helpful on these small detail-like questions. But remember, you are balancing Google searching against test answering time.
I did not need to use Google during the hands-on assessment questions. You either need to confidently know how Tableau works or you’ll find yourself playing defense and guessing.
Fun Fact: the Firefox browser on the virtual machine only displayed search results in Japanese (ども ありがと) and it took me awhile to figure out how to set English as the default language.
In short, the test was by no means easy, but with time and adequate preparation you’ll be successful. I’d say a good 7-8 months of Tableau use and 3 to 4 weeks of study time should get you where you need to be.
To prepare for the test, take a look at the official Exam Guide.
Using Tableau Public is the best way to get started learning Tableau if you don’t have a Desktop license. Download Tableau Public and practice at home because it’s free to use! The functionality is practically the same as Tableau Desktop, you just have to save your content to the cloud instead of locally.
Practice on this dataset. It is the default dataset (Tableau Superstore) that comes with the licensed version of Tableau, but you can download it from data.world thanks to Tableau Zen Master Ann Jackson.
Fast Track:
If you just want to jump right in to dash-boarding you can start with two video series I have in this playlist:
Build a Tableau Dashboard Parts 1-4
Tableau How to Build A Dashboard
Tableau How to Format A Dashboard
Slower Track to learn functionality:
Watch everything in the Creator section except Tableau Prep which is a separate tool.
Once you’ve built up confidence after passing the Tableau Desktop Specialist Exam, keep practicing and then sit for the Tableau Desktop Certified Associate Exam.
Heed my advice and you will become Tableau Certified! Keep at it and one day you’ll be opening up Ambassador Swag from Tableau.
I’m rooting for you!
All views and opinions are solely my own and do NOT necessarily reflect those of my employer.