In this video we’ll learn how to build a bar chart visualization that combines values below a certain threshold into an “OTHER” bucket. This technique is very useful when limiting the number of bars to show on your visualization while not losing sight of all the smaller values.
- Using standard Tableau Superstore data, we’ll calculate the percentage of sales that are generated by each individual state.
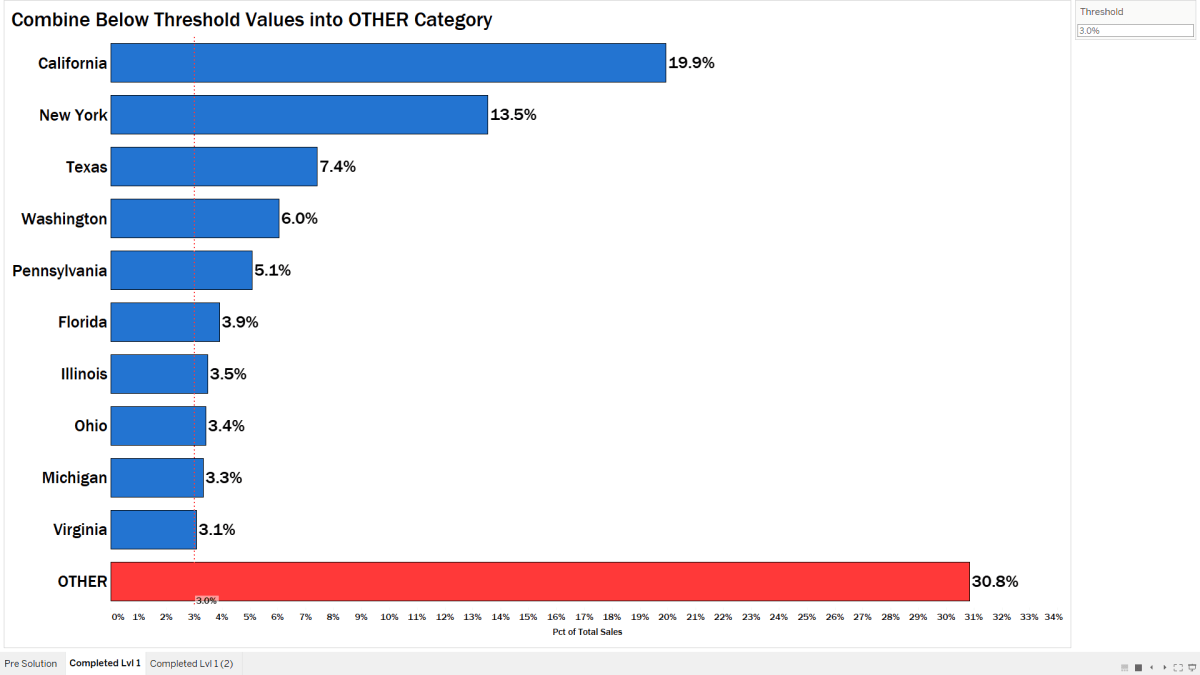
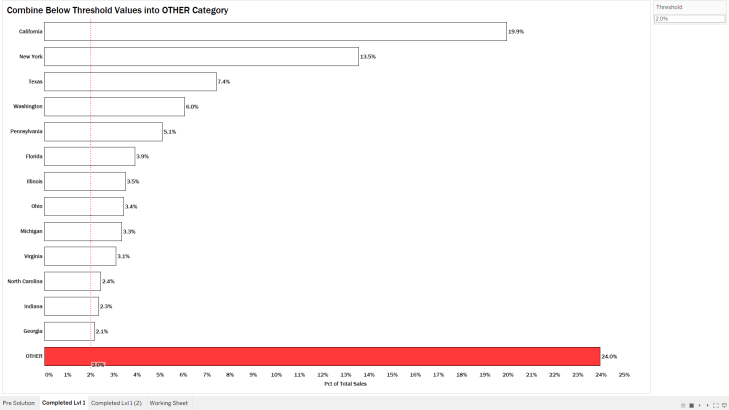
- We’ll then use a parameter to set a percentage threshold where all states below this percentage will be combined.
- This technique also requires the use of sets and Fixed LODs.
This technique allows us to combine all states below a certain threshold (e.g., 2%) into one single bar chart showing a combined 24%.
I have to give credit where credit is due to Ann Jackson for sharing this technique at TC19!
Feel free to interact with the viz and download the workbook on Tableau public:
As always, If you find this type of instruction valuable make sure to subscribe to my Youtube channel.
All views and opinions are solely my own and do NOT necessarily reflect those of my employer.
