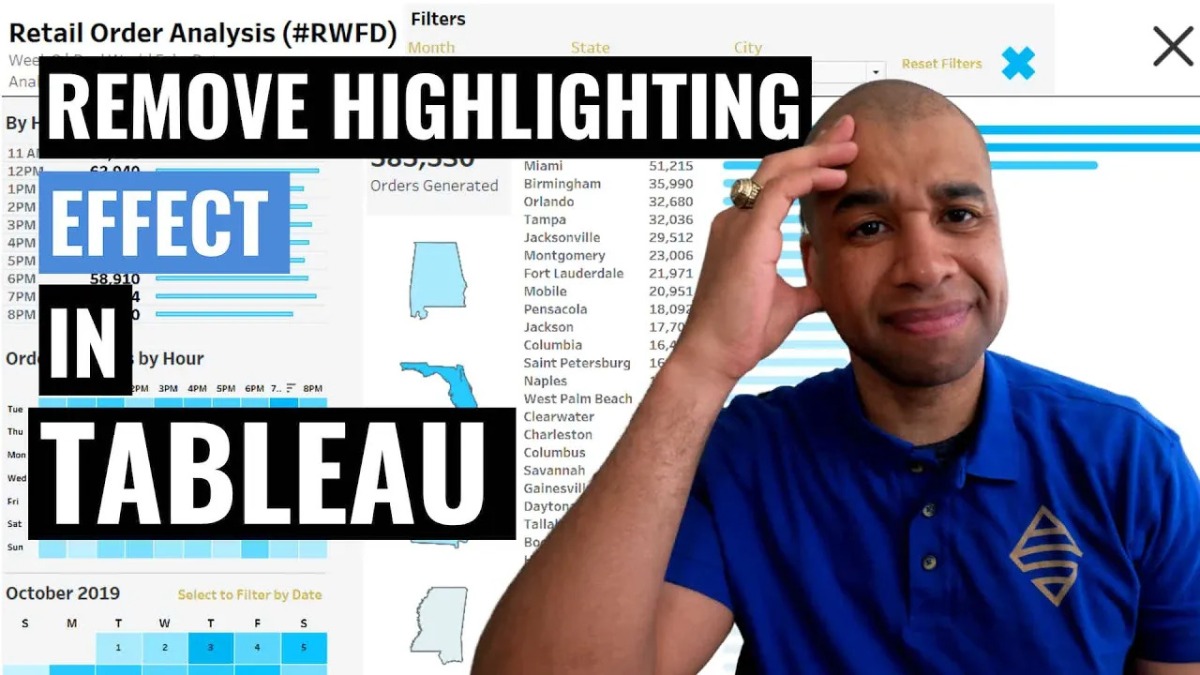
Have you ever wanted to disable the default Tableau highlighting effect when you select a mark on your chart and then remove the filter? Even when the filter is removed via the “Remove All Filters” process, it can be confusing for the user experience when all values remain “greyed out”, tricking the user into thinking that their filter is still applied. This video will help you remedy this issue and improve your dashboard user experience.

Fortunately, there is a solution to this problem that is simple and easy to implement. In this video I will show you how to use a simple calculated field and highlight action to remedy the issue. This should be default behavior in Tableau, (help us out here Tableau!)
The solution approach involves creating a boolean calculated field and setting it initially to TRUE. Then, placing this calculated field on the detail of the chart that has a filter applied. Next, adding a highlight action to the same chart that you want to remove the “greyed out” effect for. In the “Add Highlight Action” pop-up box, the Source Sheet and the Target Sheet should be the same and the Selected Fields option should have the boolean calculated field checked.
By following these steps, you will be able to remove the greyed out effect on your Tableau chart when the “Remove All Filters” process is applied.
This not only improves the appearance of your dashboard but also makes it easier to understand the data.
★☆★ THESE ADDITIONAL FILTERING VIDEOS IN TABLEAU ARE WORTH YOUR TIME ★☆★
- Reset All Filters Video: https://youtu.be/cRJYv8Htido
- Add a “Filters in Use” Alert to Your Tableau Dashboard: https://youtu.be/VU7SHXXewr8
- Fix the Reset All Filters Button in Tableau: https://youtu.be/Zg8m6Dfv714
- Understanding Tableau Context Filters: https://youtu.be/KqR93sCdK6I
- Filter Tableau Data By Wildcard Search With Multiple Keywords: https://youtu.be/CpcrQzQD_Xk
Don’t let the greyed out effect on your Tableau charts hold you back any longer. Watch the video and follow the steps outlined in this blog post to improve the appearance and functionality of your Tableau dashboards.
You can also follow my dapper data adventures on Instagram.
Stay in contact with me through my various social media presences.
All views and opinions are solely my own and do not necessarily reflect those of my employer
I appreciate everyone who has supported this blog and my YouTube channel via merch. Please check out the logo shop here.
Thank you!!
Anthony B Smoak


