Let’s learn how to build a histogram in Excel with some interesting NBA data. Personally, I use the histogram in my data analyses to help me understand how my data is distributed and to identify any outliers or extreme values that warrant further investigation. In this blog post, I’ll use Kobe Bryant’s playoff career scoring game log as our data source to create a histogram in Excel. Sound fun? Of course, it does. Let’s go!
Inserting a Histogram Chart in Excel
I advocate that you watch the video above for more detail, but you’ll find this blog post equally informative. To create a histogram in Excel, we’ll need a column of numerical data to analyze. In this case, I have Kobe Bryant’s playoff career scoring game log, which shows how many points he scored in each of his playoff games during his career. I referenced this data from basketballreference.com.
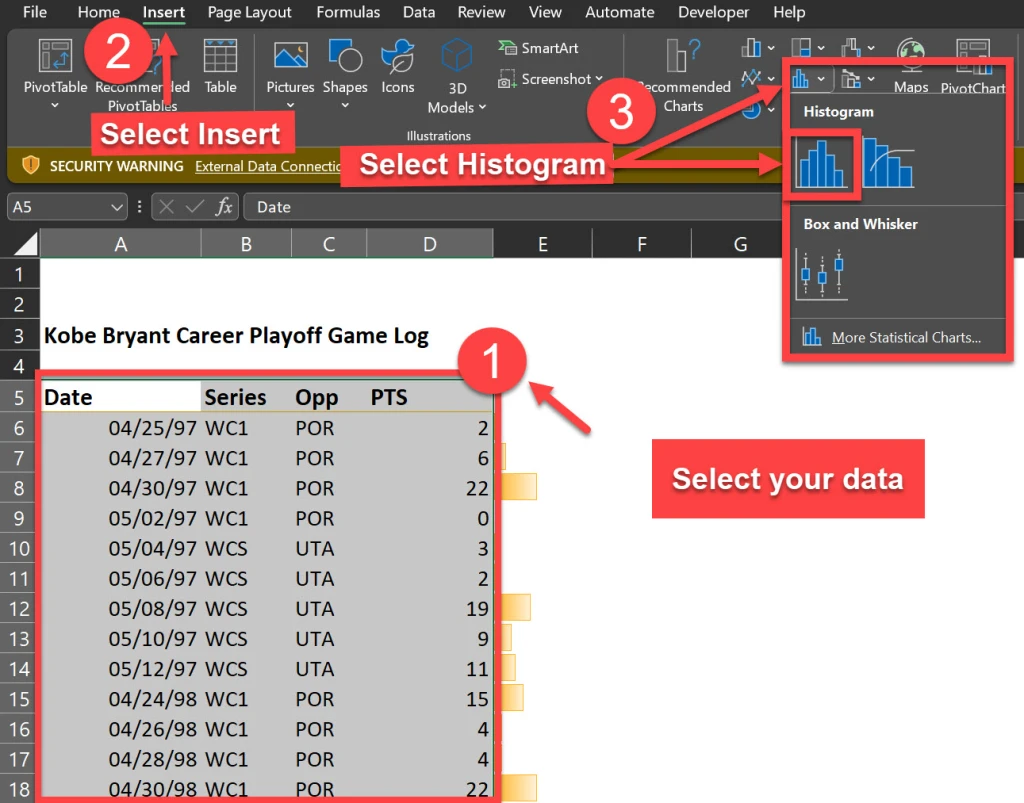
The first step is to highlight the data column and press [Ctrl + Shift + Down] to select the entire range. Then, go to the Insert tab and click on the Histogram icons as shown below. This will insert a histogram chart based on your data.
Formatting the Histogram Chart in Excel
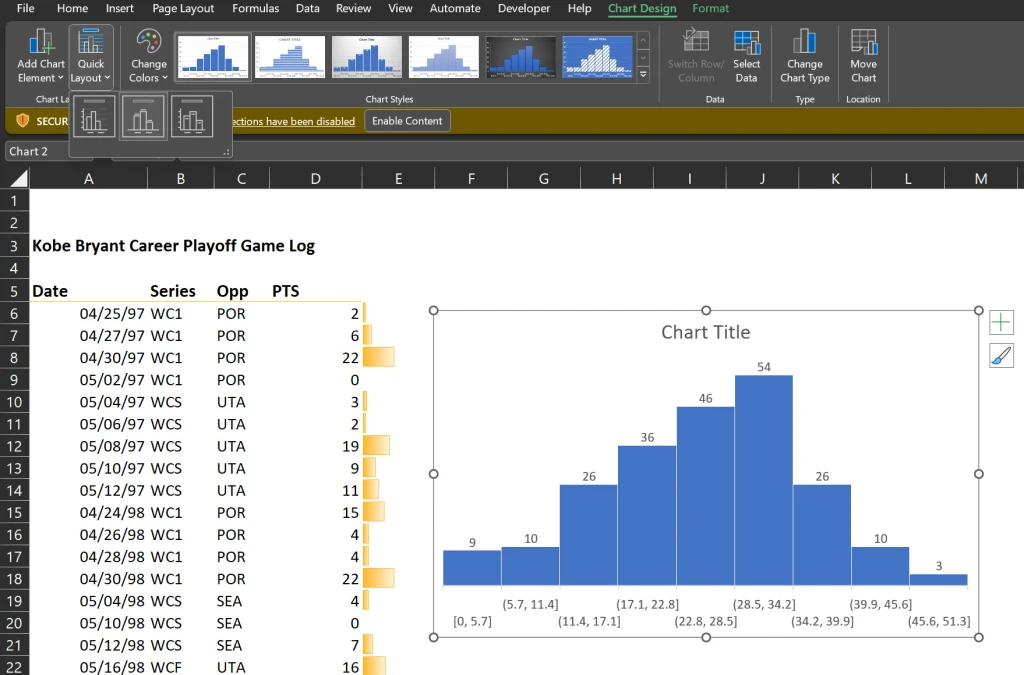
The default histogram chart may not look very attractive or informative. Thus, we will use my personal favorite technique to kick start the formatting (the “easy” way) which is the selection of “Layout 2” as a chart style.
Now this option may be easy (if you’re using Excel 2016 or greater) but you must know which additional options to change in order to make the histogram look more presentable.
The Layout 2 style does an excellent job of removing the horizontal grid lines and vertical axis (so we can keep the Edward Tufte style “chart junk” to a minimum). It also adds data labels to our bar charts as well for interpretation clarity.
Formatting the Histogram Chart in Excel
We can further improve our histogram’s appearance by applying some formatting options. For example, we can:
- Delete the grid lines and the vertical axis that we don’t need (already performed by Layout 2)
- Increase the font size of the data labels
- Change the fill color of the bars
- Add a chart title
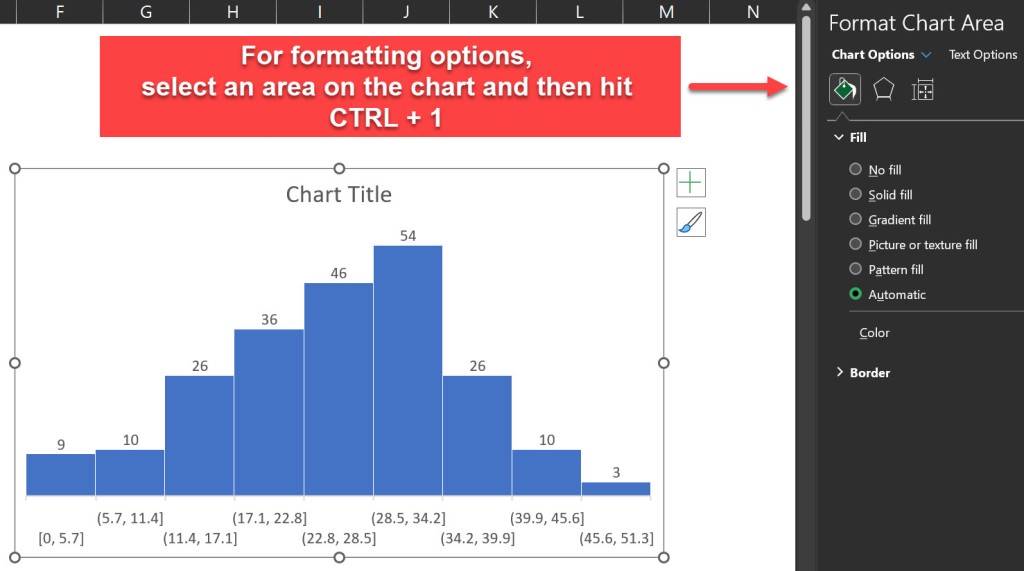
To access the formatting options, right-click on any element of the chart and select “Format”. Alternatively, we can hit [Ctrl + 1] to open the Format pane.
Adjusting the Bin Size and the Overflow/Underflow Options in Excel
One of the most important aspects of any histogram is the bin size, which determines how the data is grouped into intervals. The bin size affects the shape and the interpretation of our histogram. We can adjust the bin size by selecting the horizontal axis and changing the “Bin width” option in the Format pane.
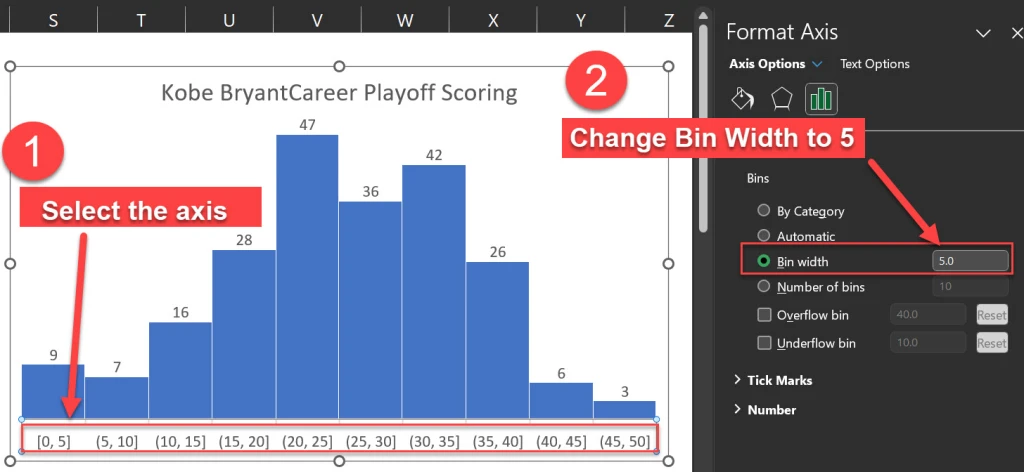
The default bin size for this data set is 5.7, which means that the data is grouped into intervals of 5.7 points. For example, the first bin includes the values from 0 to 5.7, the second bin includes the values from 5.7 to 11.4, and so on.
However, this bin size may not be very intuitive or meaningful. A better option for our histogram is to use a bin size of 5, which means that the data is grouped into intervals of 5 points. For example, the first bin includes the values from 0 to 5, the second bin includes the values from 6 to 10, and so on. This makes the histogram easier to read and understand.
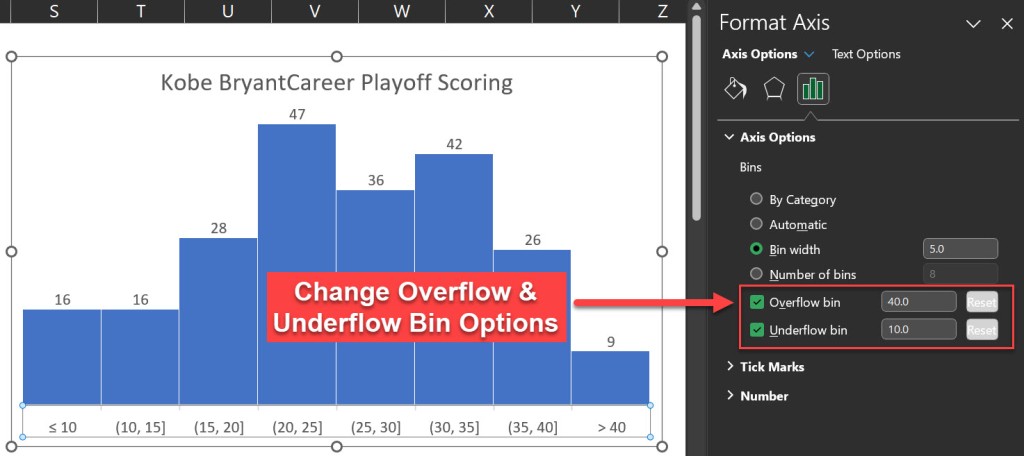
Another option that we can adjust in the histogram chart is the overflow and the underflow bins. These are special bins that capture the values that are above or below a certain threshold.
For example, we may want to create an overflow bin that includes all the games where Kobe scored more than 40 points, and an underflow bin that includes all the games where he scored less than 10 points. To do this, we can select the horizontal axis and change the Overflow bin and the Underflow bin options in the Format pane.
After applying the overflow and the underflow options, the histogram chart looks like this:
Histogram Axis Notation
You’ll notice the histogram’s horizontal axis includes both brackets “[” and parentheses “(“. I will quote the Microsoft blog to explain this notation.
“In our design, we follow best practices for labeling the Histogram axis and adopt notation that is commonly used in math and statistics. For example, a parenthesis, ‘(‘ or ‘)’, connotes the value is excluded whereas a bracket, ‘[‘ or ‘]’, means the value is included. “

In our histogram for example, the notation (20, 25] indicates that the respective bar includes any value greater than 20 but less than or equal to 25.
Interpreting the Histogram Chart and Finding Outliers in Excel
Our new histogram isn’t just pretty, it’s equally informative allowing us to answer questions that we couldn’t easily determine from a wall of numbers in spreadsheet form. The histogram easily helps us understand Kobe’s playoff scoring distribution. We also gain an understanding of his outlier games. For example, we can now:
- ..locate the mode, which is the most frequent value or interval. In this case, the mode is the interval from 20 to 25, which means that Kobe Bryant scored between 20 and 25 points in most of his playoff games.
- ..find the range, which is the difference between the maximum and the minimum values. In this case, the range is 50, which means that Kobe Bryant’s playoff scoring varied from 0 to 50 points.
- ..find the skewness, which is the asymmetry of the distribution. In this case, the distribution is right-skewed, which means that the longer tail of values is on the right side of the distribution. This indicates that Kobe Bryant’s playoff scoring was more concentrated in the lower values. This makes perfect sense as it is much harder to score more points as opposed to lesser points.
- ..find the outliers, which are the values that are far away from the rest of the data. In this case, the outliers are the point score values that are greater than 40.
I hope you enjoyed this blog post and learned how to create a histogram in Excel to analyze data distribution and outliers!!!
Let me leave you with this highlight package of Kobe’s best dunks:
I appreciate everyone who has supported this blog and my YouTube channel via merch. Please check out the logo shop here.
If you want to learn all the latest tips and tricks in core data analysis tools, stay in contact with me through my various social media presences.
And don’t forget to subscribe to my YouTube channel for more data analyst tips and tricks.
Thank you!!
Anthony B Smoak
Credit Where Credit is Due: Kobe wallpaper created by James Chen <– (great job James!!)

