I’ve been working with data for some 20 plus years as of the writing of this post. In the video below I captured my thoughts on the required hard and soft skills it takes to succeed as a data analyst. If you are looking to start your career in data as someone who has not yet graduated or as someone with tangential work experience, then this video will serve you well.
Do You Need a Computer Science Degree to be a Data Analyst?
This question is frequently asked by people such as yourself looking to make a move into data. The answer is no. You do not need a computer science degree to have a very successful data career. In the video I give my thoughts on computer science, but the reality is that although it may be helpful from a “getting a first job” perspective, it is not a requirement to succeed. Although I have an undergraduate computer science degree from Clark Atlanta University (shout-out to HBCU alums), some of the brightest minds I’ve worked with in the data space do not have a computer science degree. Bottom line; a formal computer science degree certainly helps but it is by no means necessary. All you need is the willingness to learn the tools and the perseverance to get your first data opportunity.
Do You Need a Computer Science Degree for a Data Career?
Hard Skills Required (View Video)
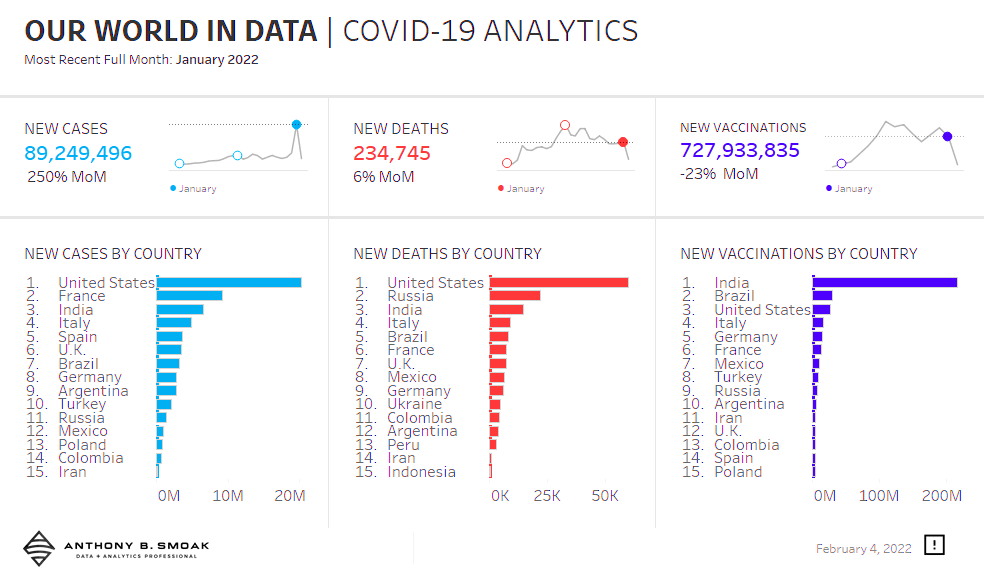
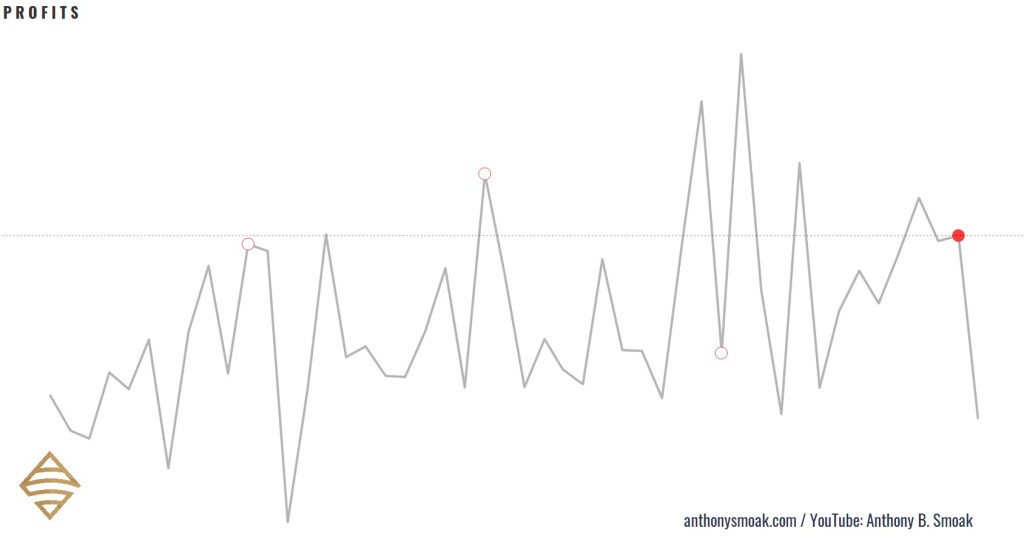
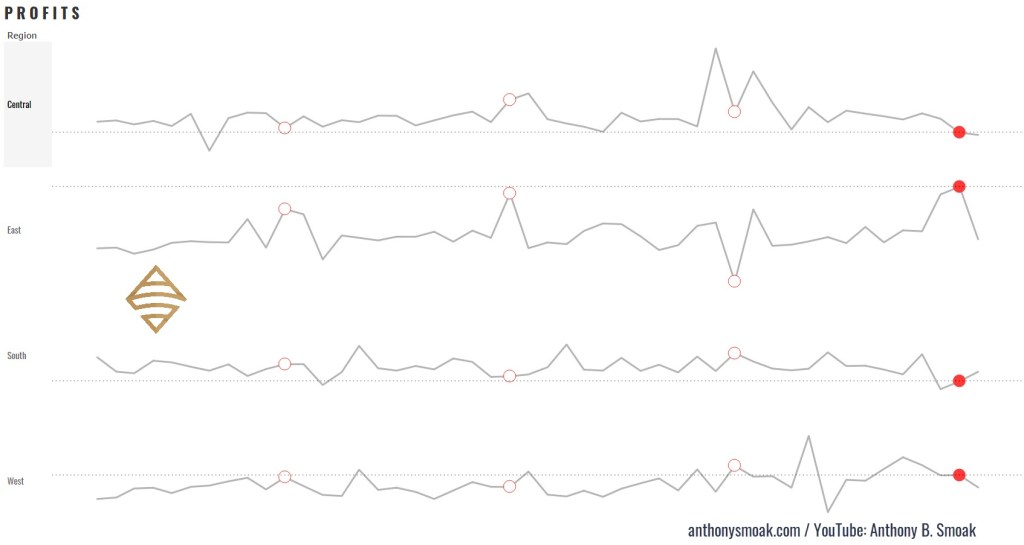
I’ll give you a hint, data visualization skills are a must and Tableau is the tool of choice for me.
Soft Skills Required
I’ll keep it short here and simply state that you should always look for ways to differentiate yourself and not just be seen as an interchangeable commodity worker. To paraphrase famed Harvard professor Michael Porter, a differentiation strategy advocates that a business must offer products or services that are valuable and unique to buyers above and beyond a low price. In this metaphor, think of yourself as a business and you bring multiple skill sets to your employer (other than being a single focus technical employee who can be easily outsourced for a lower price).
To be a differentiator, do not think of yourself as just being a tool specific analyst. Learn how to take requirements, communicate well, develop exceptional writing skills for business emails and documentation. Finally, learn how to present your analyses to people several pay grades above yourself when required. You want differentiation to be your competitive advantage. You do not want “low cost” to be your advantage for obvious reasons (if you’re like me, you want to be paid fairly for the value you provide).
Future Career Paths
In our jobs we desire mastery, autonomy and purpose. After a certain point in your career you may want to take a leap from the descriptive analytics path and move towards a predictive analytics path. Descriptive analytics (think data analyst or traditional business intelligence reporting analyst) deal with what has happened in the past while predictive analytics focus on what will most likely happen in the future. In order to level up in predictive analytics, you will need python, statistics, probability, and/or machine learning skills.
If you want to make the leap from data into management, you can consider obtaining an MBA or a masters degree in Management Information Systems. I happen to have an MBA from the Georgia Institute of Technology and a masters degree in Information Management from Syracuse. This may seem like a bit of overkill but I work in consulting where credentials are overly appreciated by clients (and I am a lifelong learner).

Conclusion
A career in data can be fun (in the early learning phases) and lucrative (mid to late career). In my case it has been a fulfilling career ever since I started work as a data analyst at General Motors many years ago. I turned myself from a commodity to a differentiator by not only learning the basics but also adding business understanding and a willingness to share what I know on this blog and my YouTube channel. I know that you can do the same. If you put in the time to learn along with the perseverance to land that first data role, you won’t need much luck at all to accomplish your goals.
Looking to land that first role or trying to move ahead in your current role? Then check out this post for the Keys for a Successful Career as a Data Analyst.
-Anthony Smoak
All views and opinions are solely my own and do not necessarily reflect those of my employer
I appreciate everyone who has supported this blog and my YouTube channel via merch. Please click here
Thank you!!