This following is a guest post contributed by Prudhvi Sai Ram, Saneesh Veetil and Chaitanya Sagar.
A dashboard is to a user what an assistant is to a boss. While an assistant helps manage multiple tasks for a boss, a dashboard helps manage multiple data sources for a user. Insights are only as good as the underlying data and dashboards are an excellent medium to provide those insights.
Dashboards provide “at-a-glance” views of key metrics which are relevant for business users to perform their tasks effectively. In other words, dashboards are an interactive form of reporting which provides users with consolidated views of different metrics to make impactful, data-driven decisions. A dashboard should speak on the creator’s behalf, acting as an expert providing actionable insights to its users. The dashboard should be self-sufficient when it comes to answering the question, “what can my data tell me?”
There are a plethora of tools available in the market for creating dashboards. However, a badly designed dashboard or incompatible (or wrong) tool can lead to hundreds of thousands of dollars in investment losses when accounting for inefficient time and effort spent by development and analysis teams. It becomes imperative for an organization to choose the right tool and have a step by step approach for dashboard development.
Currently, one of the top business intelligence tools available in the market is Tableau. It is used to create interactive dashboards for users. Tableau has been named a ‘Leader’ in the Gartner Magic Quadrant for six straight years in a row (Source – Tableau.com).
In this post, we will highlight a few best practices that you should follow when developing your Tableau dashboard. We will also talk about some of the pitfalls you should avoid while creating a Tableau dashboard.
We’ll divide the best practices into three different stages of dashboard development.
- Pre-Development: Ideation and Conceptualization
- Development
- Post Development: Maintenance
Ideation and Conceptualization
During the conceptualization and ideation stage, there are a few aspects that one should consider before starting to develop a dashboard.
1. Goal
Understand clearly why you are creating the dashboard in the first place. What is the end objective that you want to achieve via this dashboard? Is it automating a reporting process at month-end? Is it providing a better visualization to a complex calculation created in another platform?
Having a clear understanding of your dashboarding goal or objective keeps you focused and on the right track.
2. Audience
Keep in mind that your audience is a key part of creating a purposeful, impactful dashboard. The dashboard used by the CEO or other members of the C-suite will be very different from the dashboard used by business unit heads, which in turn will be very different from the dashboards used by branch managers. Thus, you need to consider who will use your dashboard and how will it be used?
For instance, a CEO is interested in key metrics at an overall organizational level like the overall financial and operational heath of the company. On the other hand, a procurement manager would be interested in the amount of material being procured from different vendors and their respective procurement costs. Having a GOAL in mind before development is essential because it helps identify the end user of the dashboard.
3. Key Performance Indicators (KPIs)
After thoroughly understanding the various stakeholder requirements, it is important to develop a list of KPIs for each user and/or department. Having the stakeholders sign-off on dashboard KPIs substantially reduces development and re-work time.
4. Data Sources
After achieving sign-off on KPIs, inventory the various data sources that are required for development. This step is important because each data source can potentially increase complexity and computing costs required to calculate the KPIs. It’s always better to only connect those data sources which contain relevant data.
5. Infrastructure
Storage and computation requirements should be taken into consideration commensurate with the dashboard’s degree of data volume and complexity. Having a right-sized backend infrastructure will improve dashboard performance considerably. Also, it is essential to understand the dashboard’s update frequency. Will the data be refreshed once a day? Is it going to be real-time? Having the answer to these questions will help generate infrastructure requirements that will prevent performance issues down the road.
Development
Once you have identified what needs to be presented on the dashboard and set up the infrastructure, it’s time to move to the second phase of dashboard development.
The following items should be considered during the development phase.
6. Design
Design is an important part of overall dashboard development. You should be very selective with the colors, fonts and font sizes that you employ. There is no rule book that establishes the right color or the right font for dashboard design; in our opinion, one should design with the company’s coloring scheme in mind.
This is a safe bet as it keeps the company’s brand identity intact, especially if the dashboard is accessible to external parties. Fonts should not be very light in color and the charts should not be very bright. Having a subtle color scheme that incorporates the brand’s identity resonates well with internal and external parties.
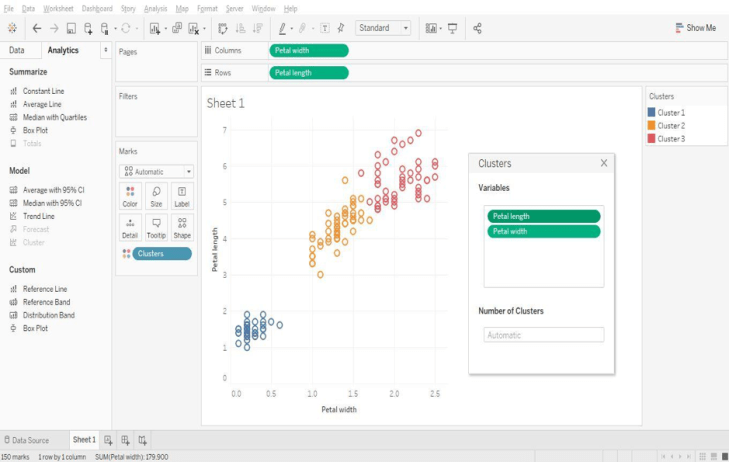
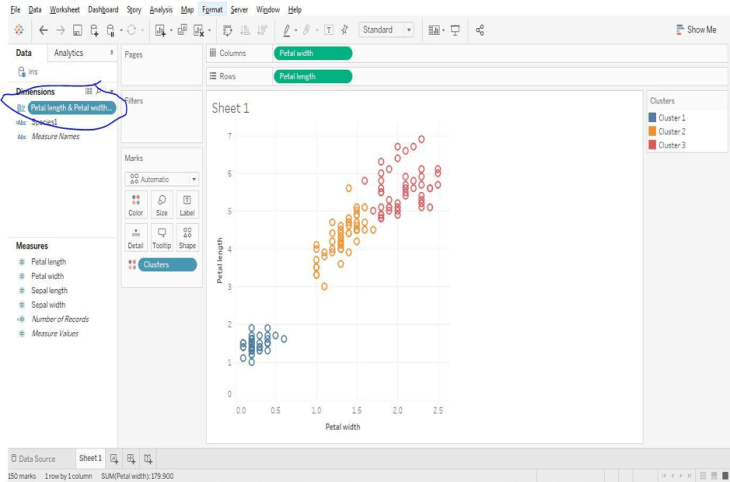
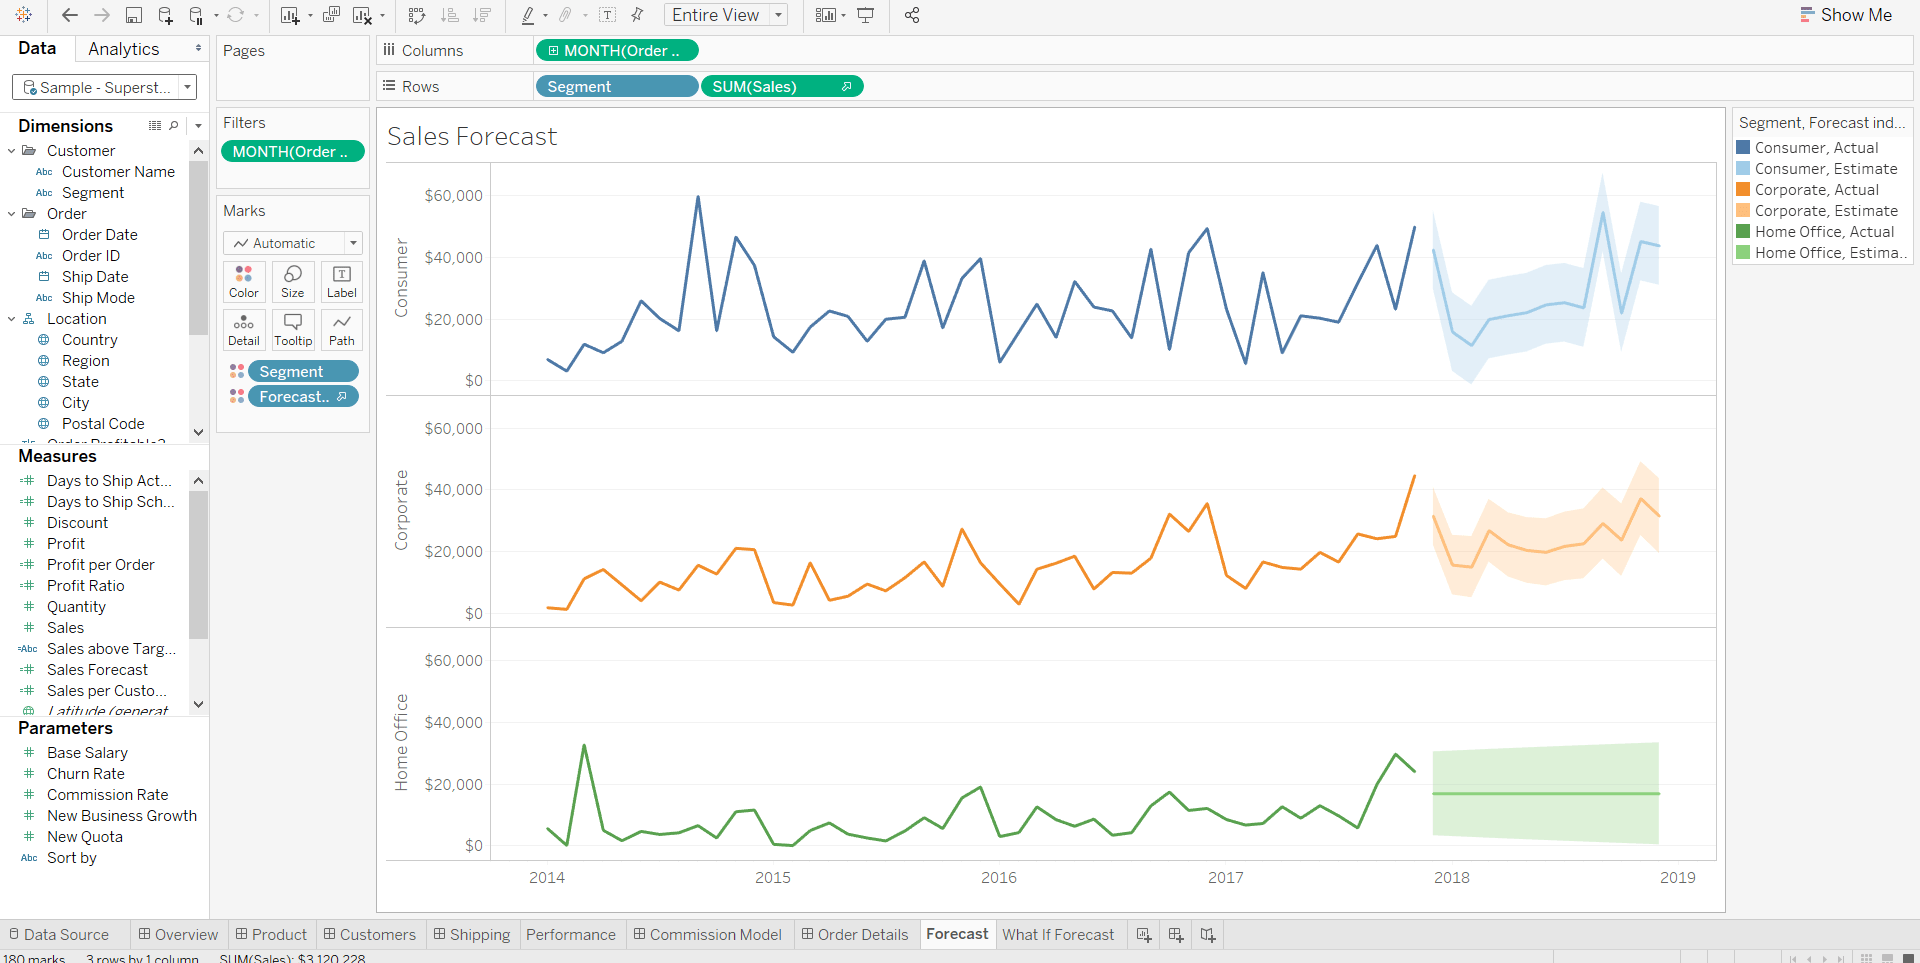
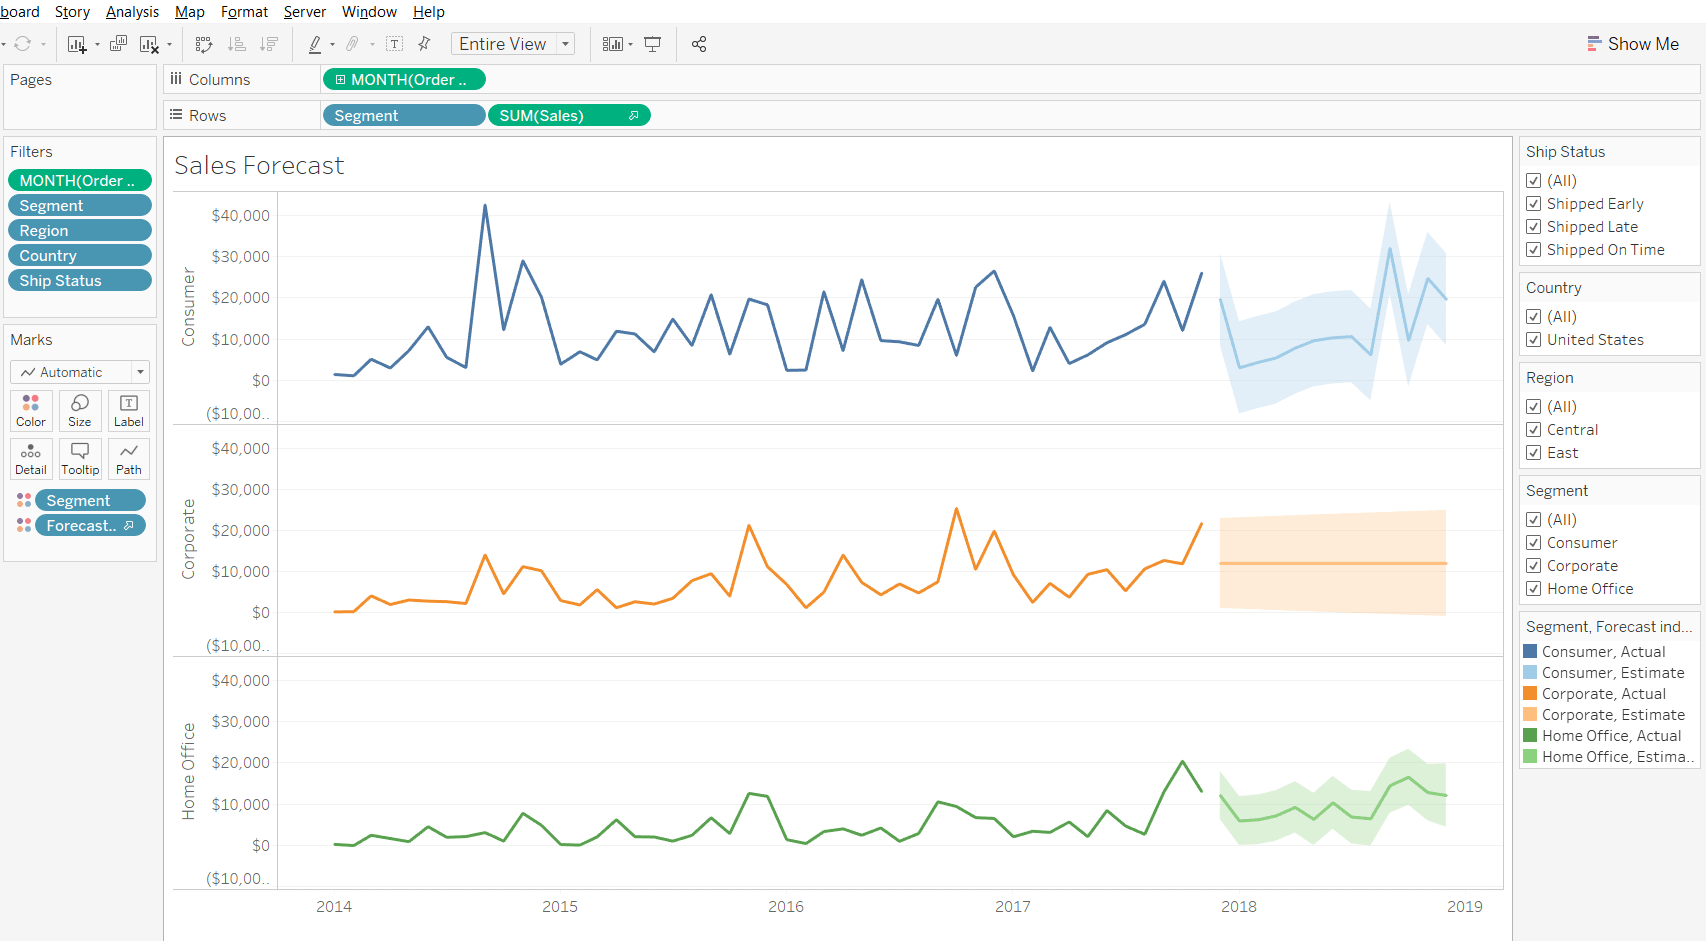
7. Visualization Impact
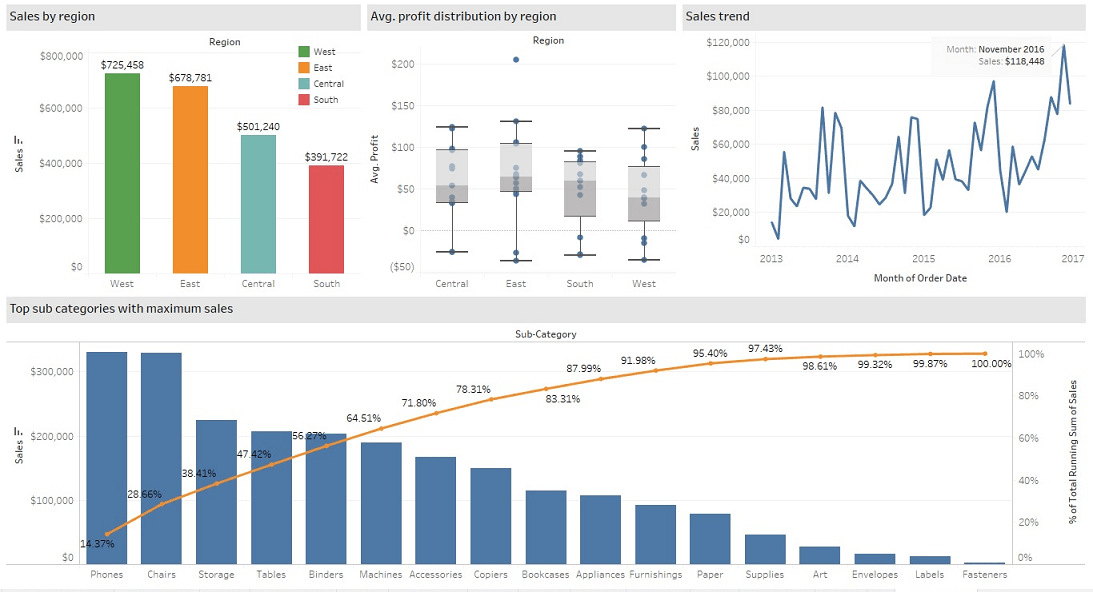
Identify the right type of visualization to create an impactful first glance for the users. Certain types of data points are better represented by certain types of visualizations. For instance, time trend analysis is usually represented on a line graph. A comparison of the same metric across different business lines are presented well via a heat map. Consider a sales dashboard where revenue and cost numbers for the current year should be presented as standalone numbers with a larger font size, while the historical trend analysis should be placed below.
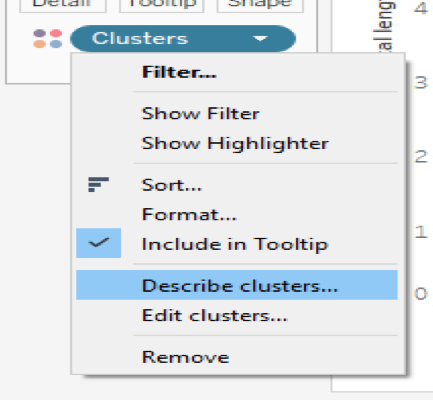
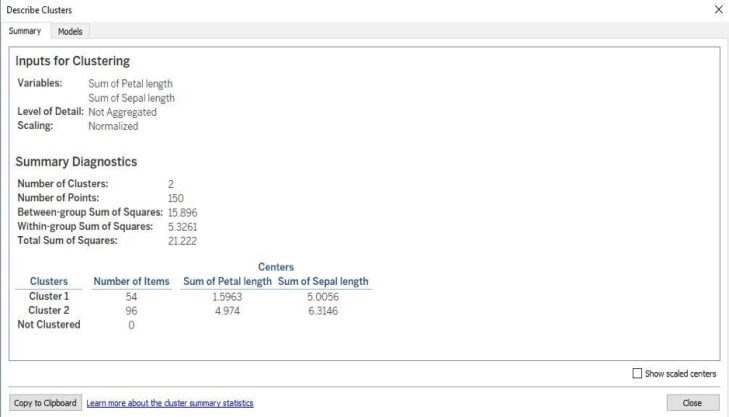
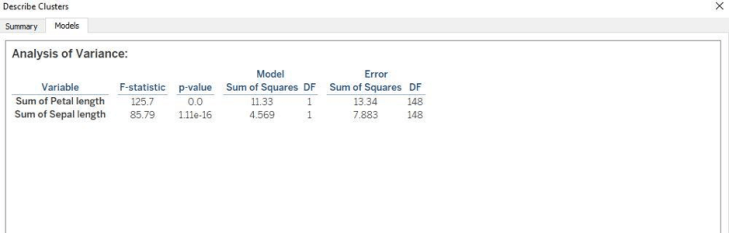
8. Captions and Comments
Tableau provides users’ with the functionality to add captions and comments to visualizations. Bear in mind that you won’t be around all the time to explain what the different charts in the dashboard represent. Therefore, add relevant descriptions, comments and/or captions wherever it can be useful for the viewer.
Post Development: Maintenance
Once you have created the dashboard, there are additional aspects you should consider for effective and smooth dashboard operation.
9. Robust Testing
After creating the dashboard, conduct robust testing of the entire platform. Testing helps identify any bugs and deployment errors which if not rectified can lead to system failure or erratic results at a later stage.
10. Maintenance
This is the most ignored phase in the dashboard development lifecycle but it is a crucial phase. Once you have created a dashboard, proper maintenance should be conducted in terms of software updates, connections to databases and infrastructure requirements. If the volume of data increases at a fast pace, you will need to upgrade the storage and computing infrastructure accordingly so that the system doesn’t crash or become prohibitively slow.
Avoid the Following
Up to this point we have highlighted some of the best practices to consider while creating a dashboard. Now, let’s broach the aspects you should avoid while creating a dashboard.
1. Starting with a Complex Dashboard
Remember that creating a dashboard is a phased approach. Trying to develop an overly complicated dashboard in one phase may complicate things and led to project failure. The ideal approach is to inventory and prioritize all requirements and proceed with a phased approach. Start development with the highest priority requirements or KPIs and gradually move to the lower priority KPIs in subsequent phases.
2. Placing Too Many KPIs on a Single Chart
Although Tableau has the capability to handle multiple measures and dimensions in a single chart, you should be judicious while choosing the dimensions and measures you want to present in a single graph. For instance, placing revenue, expenses and profit margins in a single chart may be of value; while placing revenue and vendor details in the same chart may not be as valuable.
3. Allocating Too Little Time to Deployment and Maintenance
The appropriate amount of time, budget and resources should be allocated to each constituent phase of the deployment cycle (i.e., KPI identification, dashboard development, testing and maintenance).
We are sure that after reading this post, you have a better idea regarding what practices should be considered while developing a Tableau dashboard. The principles offered here are from a high level perspective. There may be other project nuances to consider in your specific endeavors. We would be happy to hear your thoughts and the best practices that you follow while creating a Tableau dashboard.
Author Bio
Prudhvi Sai Ram, Saneesh Veetil and Chaitanya Sagar contributed to this article.