I had the honor of serving on a panel discussion at this year’s Black is Tech conference at the Georgia World Conference Center (GWCC) in Atlanta. The panel’s theme was “How do we really own our Data? Collecting, Analyzing, Visualizing and Using Black Data for Black Success”. A few of my great co-workers presented me with an opportunity to speak. I must admit that I was a bit reluctant at first due to the fact that it would take me some time to develop a presentation worthy of the event. However, I eventually embraced the opportunity when I was invited to join a panel discussion.
Upon seeing the panel’s title, I was immediately drawn to the visualization aspect, given my belief in data visualization as a crucial tool for data analysts. The “how do we really own our data” part made me think a bit. “Can we really own the data?” Cue the existential pondering.
Candid shot of me laughing at… something.
I believe there are two divergent approaches to answering this question. The strategic aspirational response is that Black people need access to capital enabling the creation of technology companies that can “own” data. As we no-doubt understand, access to capital is required in a capitalistic society but history has shown that this access has been systematically denied to Black Americans.
On the other hand, the pragmatic and short-term approach to “owning our data” involves tactics like blocking cookies on browsers and engaging more attentively and playing Whack-a-Mole with those pesky website pop-ups (admittedly, quite distinct strategies).
I had the great fortune of sharing the stage with Annie Sutton who is a Sr. Director of Analytics at Microsoft. Upon arriving at the GWCC and gazing at the conference’s main stage, we were awestruck by its size.
Once we were miked up behind the stage curtains and stepped onto the stage, we became the main act. I faced the first question, which was directed at me: “Bias in algorithms and artificial intelligence systems can disproportionately impact minority groups. How can technology companies ensure that the models they create do not perpetuate these biases and instead promote equity?”
In response, I outlined three key points, which I’ll summarize briefly. Diverse teams are essential for developing models and AI systems, along with the inclusion of diverse data in these models. Additionally, transparency in the operations of these AI models is imperative. We have to let the sun shine in and make these models very transparent. I gave a nod to the work of Dr. Joy Boulamwini (Georgia Tech and MIT graduate) who addresses AI bias issues and ways to counteract them.
The panel addressed various questions, including data literacy, which Annie Sutton addressed so well. I offered an anecdote regarding how I taught my grandmother to use ChatGPT on her iPad to develop rough outlines for her weekly sermons. She is 80 plus years young and still not too old to pick up new data skills to keep up in her profession.
I also fielded a question about Black professionals I follow in the data visualization space. I gave a shoutout to Chantilly Jaggernuath, Tim Ngwena, Chimdi Nwosu, Sekou Tyler and Patrick LeBlanc. Are there others who inspire me? Of course there are, but these were the people that first came to mind.
I believe visible Black role models in analytics are vital for inspiration and challenging the stereotype that success in analytics work is unattainable for us. By sharing our journeys and achievements, we illuminate the possibilities for young Black students trying to enter the data sphere. We’re breaking the stereotype that analytics is a members-only club.
I’m grateful that I can earn a living (a good living, I’ll add) through data and analytics work while using the internet to disseminate my work and tutorials and serving as a positive role model in this field.
All in all, my experience on the panel at the Black is Tech conference was immensely enjoyable. It’s heartening to experience the significant presence of professionals, entrepreneurs, and creators in the tech realm. Conferences like Black is Tech play a crucial role in meeting the community’s needs.
Are you a data professional looking to start a new data project?
Then you need to review my 10-point checklist to make sure you’re on the right track. Starting a new data project can be overwhelming. But don’t worry, with my 20 years of experience, I’m here to guide you through it.
Typically when I start to perform a new data related task or analysis for a project, I have to make sure that I meet the expected objectives, which often include identifying patterns, trends, and insights that can be used to drive business decisions.
10 Point Checklist
Point 1: First things first, you need to understand the nature of the deliverable that’s being asked for. Is it a new report, database table, column, data visualization, calculation, or a change to any of the above? In a similar fashion you also need to understand the technologies in play that you have to work with. This could be anything from Tableau, Power BI, SQL Server, Oracle, Teradata or even Microsoft Access (yes, people still use this tool).
Point 2: It’s crucial to know the desired delivery time frame for your project. You don’t want to end up with a longer timeline than what the project manager or client had in mind. Communication is key in this situation.
Point 3: Who is the intended audience for this deliverable? If it’s for an executive audience, you may need to roll the numbers up and take out some detail. If it’s for an analyst or operational audience, you may want to leave in more detail.
Point 4: How much historical data is required? What is the anticipated volume of data that your deliverable is going to generate? Don’t get caught in a situation where your solution can’t handle the trending analyses for a 2 year time frame when you only pulled data for the last 6 months.
Point 5: Understand the volume of data that your solution will generate. For example, a 5 million row output is not conducive to a 100% Excel approach. You will definitely be in the land of database analyses. However you may later present the data at an aggregated level (see point 3) via Excel but hopefully using a real data visualization tool .
Point 6: You need to understand if there’s any Personally Identifiable Information (PII) or sensitive data that you need to access in order to carry out the request. This could include social security numbers, passport numbers, driver’s license numbers, or credit card numbers.
Point 7: It’s important to understand the business processes behind the request. As data people, we tend to focus only on the data piece of the puzzle, but understanding more about the relevant business process can help you deliver the better results for your end users.
Point 8: Try to find and understand any relevant KPIs associated with the business processes on which your data project/task is affecting.
Point 9: Perform data profiling on your datasets! This can’t be stated enough. Profiling leads to understanding data quality issues and can help lead you to the source of the issues so they can be stopped.
Here are a few data profiling videos I’ve created over the years to give you a sense of data profiling in action.
Point 10: Understand how your solution will impact existing business process. By changing a column or calculation, how does this impact upstream or downstream processes? Keep your email inbox clean of those headache emails that are going to ask why the data looks different than it did last week. Most likely there was not a clear communication strategy to inform everyone of the impact of your changes.
Bonus Considerations:
Here are a few bonus considerations since you had the good fortune of reading this blog post and not just stopping at the video.
Bonus Point 1: Consider any external factors that could impact your data project. For example, changes in regulations can impact the data that you collect, analyze, and use. If the government imposes stricter regulations on data privacy (see point 6 above), you may need to change your data sources or analysis methods to comply with these regulations.
Bonus Point 2: Consider internal organizational politics when starting on a project. If you work in a toxic or siloed organization (it happens), access to data can be a challenge. For example, if the marketing department controls customer data, accessing that data for a sales analysis project may be challenging due to internal strife and/or unnecessary burdensome roadblocks.
Internal politics can also lead to potential conflicts of interest, such as when stakeholders have different goals or agendas. For example, if your data analyses could impact a department’s budget, that department may have an incentive to influence your work outcome to their advantage (or try to discredit you or your work by any means necessary).
Bonus Point 3: Finally, make sure to document everything. This includes the business requirements, technical requirements, saved emails, and any changes that were made along the way.
When I started my first office position as an intern at a well known Fortune 500 company, my mentor told me the first rule of corporate life was to C.Y.A. I’m sure you know what that means to cover. Having solid documentation of your work and an email trail for decisions made along the way can keep you out of hot water.
Conclusion
And there you have it, my 10-point checklist for starting a new data project. By following these steps, you’ll be well on your way to delivering high-quality results. Don’t forget to like and subscribe for more data-related content!
I’m proud to announce that I recently passed the Tableau Certified Data Analyst certification. If you found this article, most likely you are looking for a perspective on the exam and how to pass and earn this certification yourself. Here is the story of my journey, which may differ from the typical experience.
I had a New Year’s resolution to add the Tableau Certified Data Analyst certification to my resume because the Tableau Desktop Certified Associate certification I held was due to expire. If you want to read up on how I passed that older exam, you can find my insights here. Some of those insights will also serve you well on passing the current exam.
I believe that certification has its advantages. It’s a way to signal to potential and current employers that you have some defined level of competency in a targeted skill. It’s also a means to strengthen the case to your employer that you deserve additional compensation (if you are under-compensated). Fortunately, I am compensated fairly now, but this has not always been the case (shout-out to highly competent middle office IT pros toiling away underappreciated, but I digress). Finally, studying allows you to stay up-to-date on the latest tools and trends in your chosen domain.
How Much Experience Do You Need?
The official exam guide states, “The best preparation is role experience and time with the product. To be prepared, candidates are strongly encouraged to have at least 6 months of experience.” I would tend to agree with this if you have used the tool extensively during this time frame. Otherwise, I would recommend at least 1 to 2 years experience with the tool and as a data analyst before attempting to sit for this one. Focus on obtaining the Tableau Specialist certification (it never expires) first before attempting this exam.
Why Did I Get Certified?
For my purposes as a senior manager in a consulting practice, certification certainly has benefits with respect to establishing credibility quickly on new projects. I may hold a manager title but you’ll never pry my hands away from keyboard-centric hands-on technical work, as I enjoy being a technical subject matter expert (and teaching/mentoring others).
Other than employment and signaling purposes, an additional benefit of certification is the personal growth and esteem benefits that you gain from tackling a goal. My body of work is visible online and I have years of relevant experience, thus certification is not something I necessarily needed but something I desired.
The main difference between the new Certified Data Analyst exam and the older Desktop Certified Associate exam is that you will now be tested on Tableau Prep, Tableau Server and Tableau Online. Having to understand aspects of Server and Online were initial concerns I held before taking this test.
I have about 7 years of experience between Tableau Public & Desktop and about a year of experience with Tableau Prep so that was not an issue. I have used Tableau Server to publish my dashboards while on a project at a large Fortune 500 company, but I would by no means consider myself a server expert. I’ve used Prep to transform data for clients without issue as it is easy to pick up with exposure and usage. Look at this listing of domain items covered on the exam.
My strategy to compensate for a lack of deep hands on experience in Domain 4 was to perform really well on all the other domains. Using this strategy, I could still potentially score 91% max (assuming I miss every Domain 4 question which would be highly improbable). If you are like me and have deep knowledge of Tableau Desktop, then you should be fine. Do not use a lack of server experience as an excuse to avoid certification. Simply read up on publishing content at these links and you should have a fighting chance. Personally, I found the Certified Data Analyst exam to be somewhat easier than the Desktop Certified Associate exam. Not easy, just a little bit easier with respect to the Tableau Desktop asks.
Another difference between the Certified Data Analyst exam and the older Desktop Certified Associate exam is the presence of a hands-on lab portion. I honestly found this to be the easiest section on the test, although your mileage may vary. There was one question that had me stumped only because I wasn’t sure what was being asked so I built a visual that probably did not reflect the ask. Other than that 1 question, I felt that I nailed this section.
The official exam guide states, “Candidates are encouraged to comment on items in the exam. Feedback from all comments is considered when item performance is reviewed prior to the release of new versions of exam content.” In hindsight, I should have left a comment on the question stating “unclear”.
For the hands on lab (I’m not sharing anything that isn’t already on the exam guide), definitely be familiar with filter and highlight actions, how to use a TOP N filter, how to use parameters with filters, labels, and how to add reference lines and perform custom sorting.
How Did I Prepare?
Honestly, I meant to prepare for at least a week beforehand, but life got in the way. Thus, I literally crammed my review into the span of 7 hours the Saturday before sitting the exam. I do not recommend this if you are not well versed in the tool. I simply needed to review some concepts. The listing at this website provides great links to official Tableau documentation for the subject areas covered on the exam.
Results
I completed the exam with about 35 minutes to spare. After I submitted my results online, I only had to wait an hour before I received an email stating that I had a score available. This is in stark contrast to when the beta exam was in effect. I heard that results would take months to process. I cleared the 75% hurdle despite studying for only a few hours and not having deep experience with Tableau server. I could have easily scored higher given more study time, but I was happy to pass the exam given the meager study time I allotted to the task. I’m not saying that the test was easy, I’m just fortunate that I’ve had enough experience with Desktop that I could “sacrifice” in other areas and still make it across the finish line. This strategy may not work for you if you have under a year’s experience with the tool.
Focus on These Subject Areas:
However, here is the section you came for, this is my abridged list of test focus areas. Make sure to focus on these subject areas to give yourself a good shot at passing the exam.
Start here: Here are 5 useful videos from my catalog that you should review to level up for the exam. I promise they are worth your time and will help you prepare. Do me a favor and like the videos to help others find the content as well!
Best of luck to you. I know that you can pass this test if you have decent hands on experience with the tool. For those of you without a Tableau license, use Tableau Public to study and fill in gaps by reading blogs, watching videos and using Tableau official documentation. I believe in you!
About Me (Data background):
Experience: 15 Years Industry + 8 Years Analytics Consulting
Tableau Certified Data Analyst
2X Tableau Ambassador
M.S. Quantitative Management – Business Analytics – Duke University
I’ve been working with data for some 20 plus years as of the writing of this post. In the video below I captured my thoughts on the required hard and soft skills it takes to succeed as a data analyst. If you are looking to start your career in data as someone who has not yet graduated or as someone with tangential work experience, then this video will serve you well.
Do You Need a Computer Science Degree to be a Data Analyst?
This question is frequently asked by people such as yourself looking to make a move into data. The answer is no. You do not need a computer science degree to have a very successful data career. In the video I give my thoughts on computer science, but the reality is that although it may be helpful from a “getting a first job” perspective, it is not a requirement to succeed. Although I have an undergraduate computer science degree from Clark Atlanta University (shout-out to HBCU alums), some of the brightest minds I’ve worked with in the data space do not have a computer science degree. Bottom line; a formal computer science degree certainly helps but it is by no means necessary. All you need is the willingness to learn the tools and the perseverance to get your first data opportunity.
I’ll keep it short here and simply state that you should always look for ways to differentiate yourself and not just be seen as an interchangeable commodity worker. To paraphrase famed Harvard professor Michael Porter, a differentiation strategy advocates that a business must offer products or services that are valuable and unique to buyers above and beyond a low price. In this metaphor, think of yourself as a business and you bring multiple skill sets to your employer (other than being a single focus technical employee who can be easily outsourced for a lower price).
To be a differentiator, do not think of yourself as just being a tool specific analyst. Learn how to take requirements, communicate well, develop exceptional writing skills for business emails and documentation. Finally, learn how to present your analyses to people several pay grades above yourself when required. You want differentiation to be your competitive advantage. You do not want “low cost” to be your advantage for obvious reasons (if you’re like me, you want to be paid fairly for the value you provide).
Future Career Paths
In our jobs we desire mastery, autonomy and purpose. After a certain point in your career you may want to take a leap from the descriptive analytics path and move towards a predictive analytics path. Descriptive analytics (think data analyst or traditional business intelligence reporting analyst) deal with what has happened in the past while predictive analytics focus on what will most likely happen in the future. In order to level up in predictive analytics, you will need python, statistics, probability, and/or machine learning skills.
If you want to make the leap from data into management, you can consider obtaining an MBA or a masters degree in Management Information Systems. I happen to have an MBA from the Georgia Institute of Technology and a masters degree in Information Management from Syracuse. This may seem like a bit of overkill but I work in consulting where credentials are overly appreciated by clients (and I am a lifelong learner).
A career in data can be fun (in the early learning phases) and lucrative (mid to late career). In my case it has been a fulfilling career ever since I started work as a data analyst at General Motors many years ago. I turned myself from a commodity to a differentiator by not only learning the basics but also adding business understanding and a willingness to share what I know on this blog and my YouTube channel. I know that you can do the same. If you put in the time to learn along with the perseverance to land that first data role, you won’t need much luck at all to accomplish your goals.
Data is the lifeblood of organizations. By now you’ve probably heard the comparative slogans “data is the new oil” or “data is the new water” or “data is the new currency”. A quick type of “data is the new” into the Google search bar and the first result delivered is “data is the new bacon”. I’m not sure how apt this slogan is except to say that both can be highly fulfilling.
With the exception of a well-known Seattle based retailer, most enterprises experience substantial data quality issues as data quality work is typically an exercise in “pass the buck”. An Information Week article shrewdly commented on the risks associated with the lack of data quality:
“There are two core risks: making decisions based on ‘information fantasy,’ and compliance. If you’re not representing the real world, you can be fined and your CFO can be imprisoned. It all comes down to that one point: If your systems don’t represent the real world, then how can you make accurate decisions?” [3]
The Handbook of Data Quality: Research and Practice has reported that 60% of enterprises suffer from data quality issues, 70% of manufacturing orders contained poor quality data and that poor data quality management costs companies roughly $1.4 billion every year [4].
Organizational Hamilton/Burr style face-offs occur in which IT and the business are at loggerheads over the state of data quality and ownership. The business typically believes that since data is co-mingled with the systems that IT already manages, IT should own any data issues. With the high costs of poor data quality I just cited, and the risks of nimble disrupters utilizing data more efficiently to attack incumbents’ market share, both IT and the business need to be on the same team with regard to data quality for the organization’s sake.
“The relationship between IT and the business is a source of tension in many organizations, especially in relation to data management. This tension often manifests itself in the definition of data quality, as well as the question of who is responsible for data quality.” [5]
Anecdotally, IT units do not have the desire to be held responsible for “mysterious” data and/or systems that they had no hand in standing up. In my opinion, the enterprise IT mindset is to make sure the data arrives into the consolidated Enterprise Data Warehouse or other centralized data repository; and if downstream users don’t raise concerns about data quality issues, all the better for IT. Garbage-In, Garbage-Out. If the checksums or record counts from source to target match, then it’s time to call it a day.
The developer or analyst related mindset is to immediately dive in and start building applications or reports with the potential to deliver sub-optimal results because the data was misunderstood or misinterpreted as the “golden copy”. Up-front data profiling isn’t in the equation.
Gartner has suggested that the rise of the Chief Data Officer (particularly in banking, government and insurance industries) has been beneficial towards helping both IT and the business with managing data [2]. The strategic usage of a CDO has the potential to free up the CIO and the enterprise IT organization so they can carry on with managing infrastructure and maintaining systems.
However, most experts will agree that the business needs to define what constitutes high-quality acceptable data and that the business should “own the data”. However, IT is typically the “owner” of the systems that house such data. Thus, a mutually beneficial organizational relationship would involve IT having a better understanding of data content so as to ensure a higher level of data quality [5].
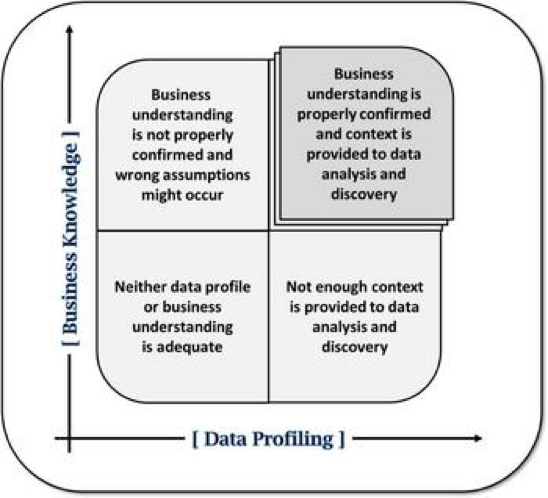
From a working together perspective, I find this matrix from Allen & Cervo (2015) helpful in depicting the risks arising from one sided data profiling activities without business context and vice versa. It illustrates how both “business understanding and data profiling are necessary to minimize any risk of incorrect assumptions about the data’s fitness for use or about how the data serves the business” [1]. Although originally offered in a Master Data Management context, I find the example fitting in illustrating how business and IT expertise should work together.
From: Allen, M. & Cervo, D (2015) Multi-Domain Master Data Management: Advanced MDM and Data Governance in Practice. Morgan Kaufmann Publishers. Chapter 8 – Data Integration.
From the bottom left quadrant, low business knowledge and inadequate data profiling activities leaves the enterprise in a less than optimal position. This is not the quadrant an organization needs to languish within.
The top left quadrant illustrates that business context is high but “knowledge” is unsubstantiated because of the lack of understanding of data quality via profiling exercises. Cue quality guru W. Edwards Deming stating, “Without data, you’re just a person with an opinion.”
The bottom right quadrant illustrates the opposite problem where data profiling without business knowledge doesn’t yield enough context for meaningful analyses. Cue a “bizarro” W. Edwards Deming stating, “Without an opinion, you’re just a person with data.”
The “Goldilocks” quadrant in the upper right yields appropriate understanding of data quality and the necessary context in which to conduct meaningful analyses.
The more engaged that the business and IT are in finding common ground with respect to understanding existing data and solving data quality issues, the better positioned the organization is to avoid regulatory fines, departmental strife, threats from upstart firms and overall bad decision making. Refuse to become complacent in the data space and give data the attention it deserves, your organization’s survival just may depend upon it.
References:
[1] Allen, M. & Cervo, D (2015) Multi-Domain Master Data Management: Advanced MDM and Data Governance in Practice. Morgan Kaufmann Publishers. Chapter 8 – Data Integration.
[4] Sadiq, Shazia (Ed.) (2013). Handbook of Data Quality: Research and Practice: Cost and Value Management for Data Quality.
[5] Sebastian-Coleman, L. (2013). Measuring Data Quality for Ongoing Improvement: A Data Quality Assessment Framework. Morgan Kaufmann Publishers. Chapter 2 – Data, People, and Systems.
By now it’s an all too common cliché that the IT department does not garner the respect it deserves from its counterpart areas of the business. This perceived respect deficiency can manifest itself in the lack of upfront involvement in business strategy (we’ll call you when it breaks), unreasonable timelines (do it yesterday), rampant budget cuts and layoffs (do more with less) and/or limited technical promotional tracks (promotions are for business areas only).
IT pros tend to believe that if they’re adding value, delivering difficult solutions within reasonable timeframes and providing it all in a cost efficient manner, the recognition and gratitude will follow. Typical IT and knowledge worker responsibilities fall under the high level categories of “keep things running” (you’re doing a great job so we don’t notice) or “attend to our technical emergency” (drop what you’re doing).
It’s fair to say that there is a perception gap between the true value and the perceived value of what IT brings to the table. Anecdotally, there certainly seems to be a disconnect between the perceived lack of difficulty in business asks and the actual difficulty in delivering solutions. This perception gap can occur not only between IT and the “business” but also between the non-technical IT manager and the technical rank and file.
In this era of automation, outsourcing and job instability, there is an element of danger in one’s contributions going unnoticed, underappreciated and/or misunderstood. Within IT, leaders and the rank and file need to overcome their stereotypical introverted nature and do a better job of internally marketing their value to the organization. IT rank and file need to better market their value to their managers, and in turn the IT department collectively needs to better market its value to other areas of the business.
Perception matters, but IT must deliver the goods as well. If the business misperceives the actual work that the IT department provides and equates it to commoditized functions such as “fix the printers” or “print the reports” then morale dips and the IT department can expect to compete with external third parties (vendors, consulting firms, outsourcing outfits) who do a much better job of finding the ear of influential higher–ups and convincing these decision-makers of their value.
I once worked on an extremely complex report automation initiative that required assistance from ETL developers, architects, report developers and business unit team members. The purpose was to gather information from disparate source systems, perform complex ETL on the data then and store it in a data-mart for downstream reporting. Ultimately the project successfully met its objective of automating several reports which in-turn saved the business a week’s worth of manual excel report creations. After phase 1 completion, the thanks I received was genuine gratitude from the business analyst whose job I made easier. The other thanks I received was “where’s phase 2, this shouldn’t be that hard” from the business manager whose technology knowledge was limited to cutting and pasting into excel.
Ideally my team should have better marketed the value and helped the business partner understand the appropriate timeliness (given the extreme complexity) of this win, instead of just being glad to move forward after solving a difficult problem for the business.
I believe Dan Roberts accurately paraphrases the knowledge worker’s stance in his book Marketing IT’s Value.
“’What does marketing have to do with IT? Why do I need to change my image? I’m already a good developer!’ Because marketing is simply not in IT’s comfort zone, they revert to what is more natural for them, which is doing their technical job and leaving the job of marketing to someone else, which reinforces the image that ‘IT is just a bunch of techies.’”
The IT department needs to promote better awareness of its value before the department is shut out of strategic planning meetings, the department budget gets cut, project timelines start to shrink and morale starts to dip. IT workers need to promote the value they bring to the table by touting their wins and remaining up to date in education, training and certifications as necessary. At-will employment works both ways, if the technical staff feels stagnant, undervalued and underappreciated, there is always a better situation around the corner; especially considering the technical skills shortage in today’s marketplace.
“It’s not about hype and empty promises; it’s about creating an awareness of IT’s value. It’s about changing client perceptions by presenting a clear, consistent message about the value of IT. After all, if you don’t market yourself, someone else will, and you might not like the image you end up with [1]”


 From: Allen, M. & Cervo, D (2015) Multi-Domain Master Data Management: Advanced MDM and Data Governance in Practice. Morgan Kaufmann Publishers. Chapter 8 – Data Integration.