
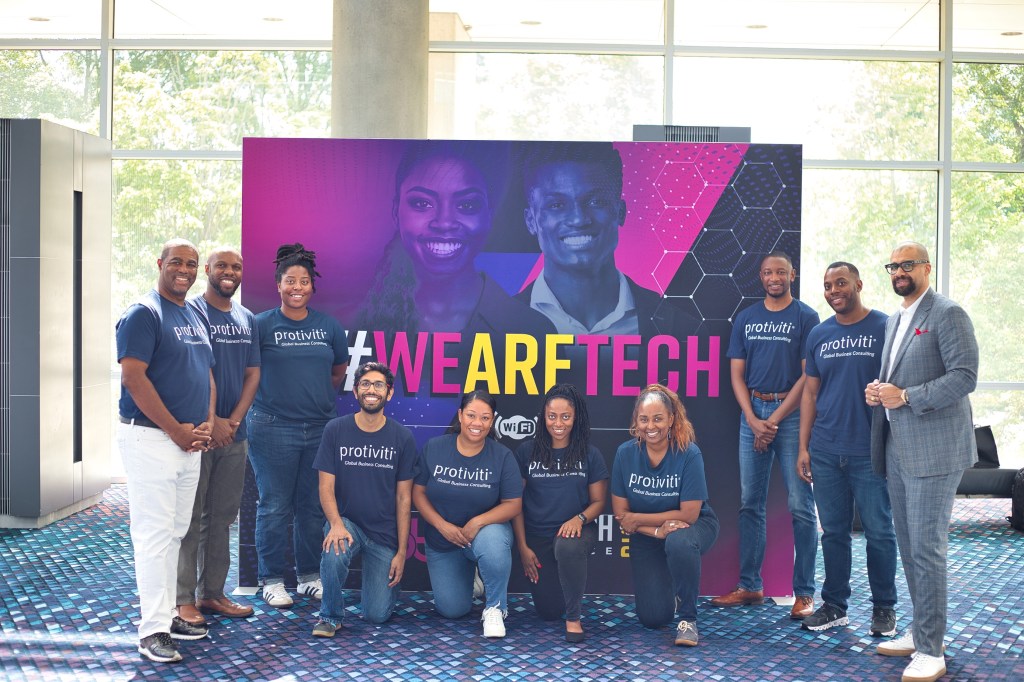
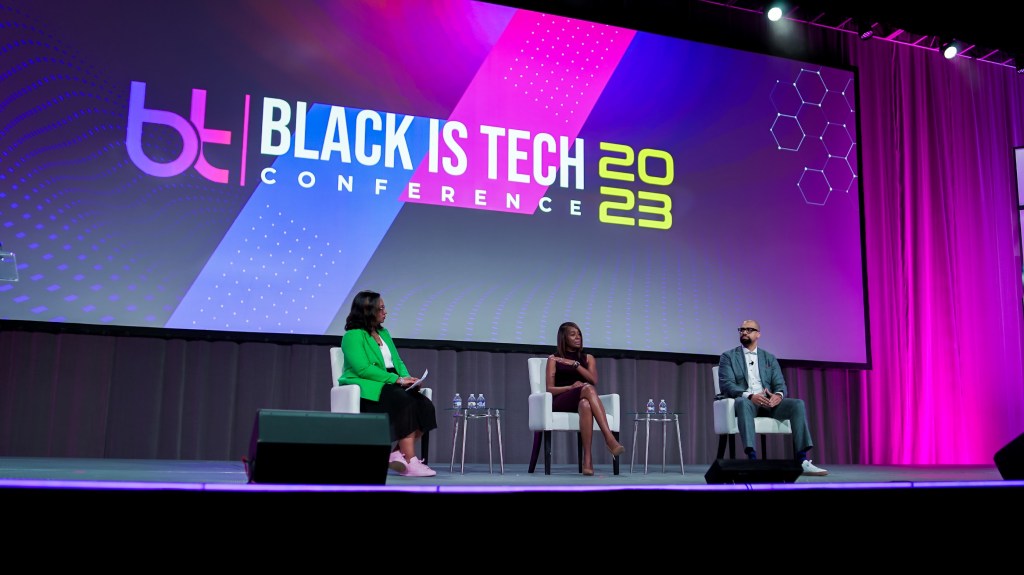
I had the honor of serving on a panel discussion at this year’s Black is Tech conference at the Georgia World Conference Center (GWCC) in Atlanta. The panel’s theme was “How do we really own our Data? Collecting, Analyzing, Visualizing and Using Black Data for Black Success”. A few of my great co-workers presented me with an opportunity to speak. I must admit that I was a bit reluctant at first due to the fact that it would take me some time to develop a presentation worthy of the event. However, I eventually embraced the opportunity when I was invited to join a panel discussion.
Upon seeing the panel’s title, I was immediately drawn to the visualization aspect, given my belief in data visualization as a crucial tool for data analysts. The “how do we really own our data” part made me think a bit. “Can we really own the data?” Cue the existential pondering.
I believe there are two divergent approaches to answering this question. The strategic aspirational response is that Black people need access to capital enabling the creation of technology companies that can “own” data. As we no-doubt understand, access to capital is required in a capitalistic society but history has shown that this access has been systematically denied to Black Americans.
On the other hand, the pragmatic and short-term approach to “owning our data” involves tactics like blocking cookies on browsers and engaging more attentively and playing Whack-a-Mole with those pesky website pop-ups (admittedly, quite distinct strategies).
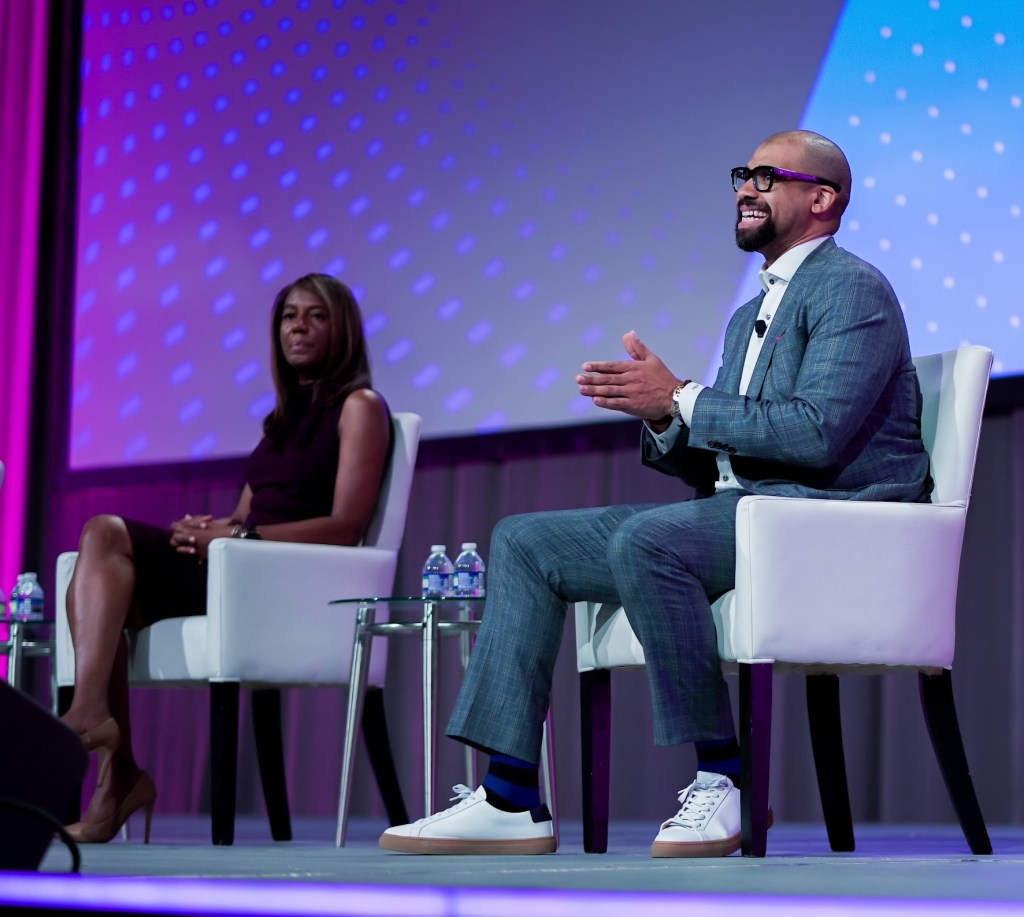
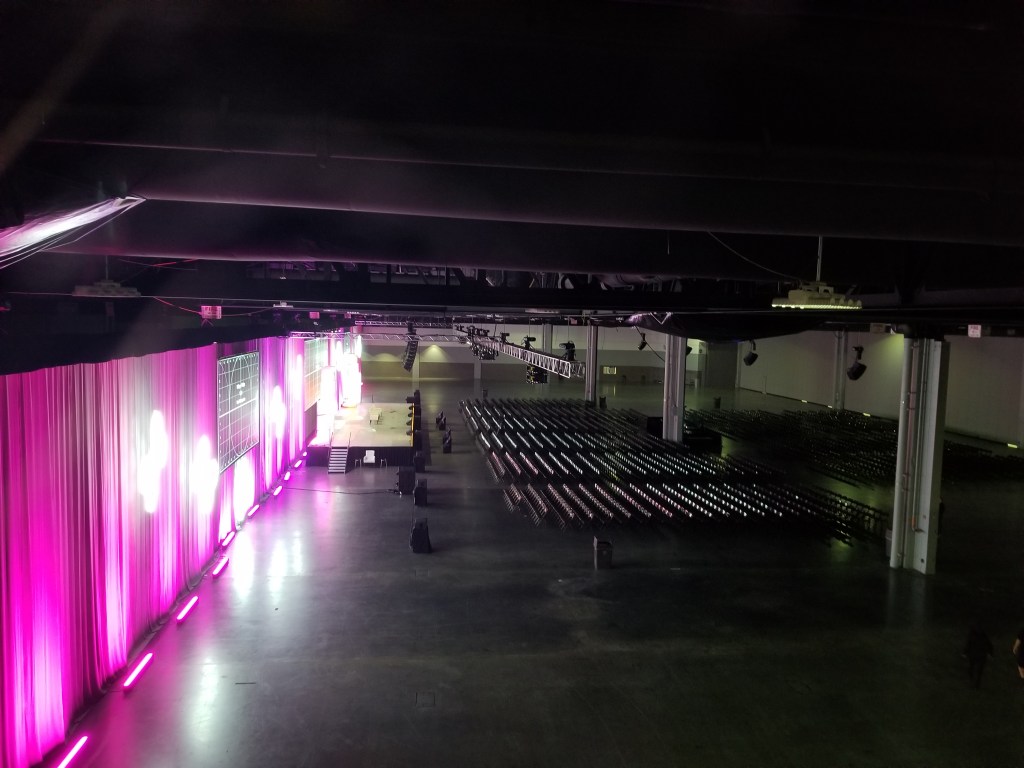
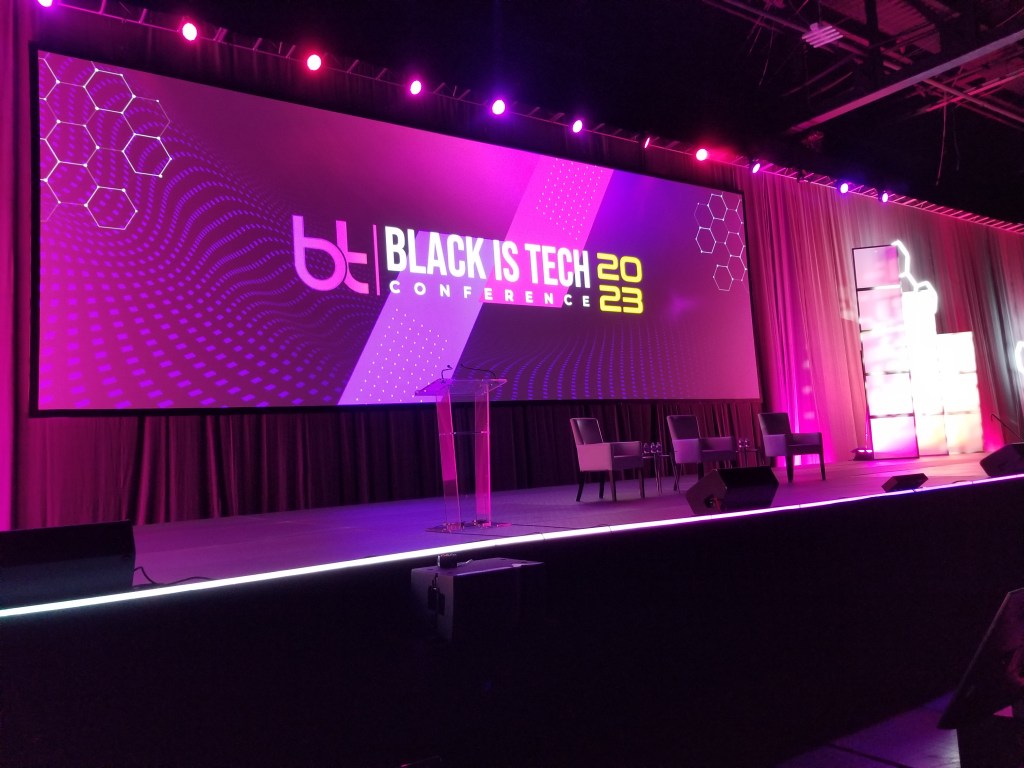
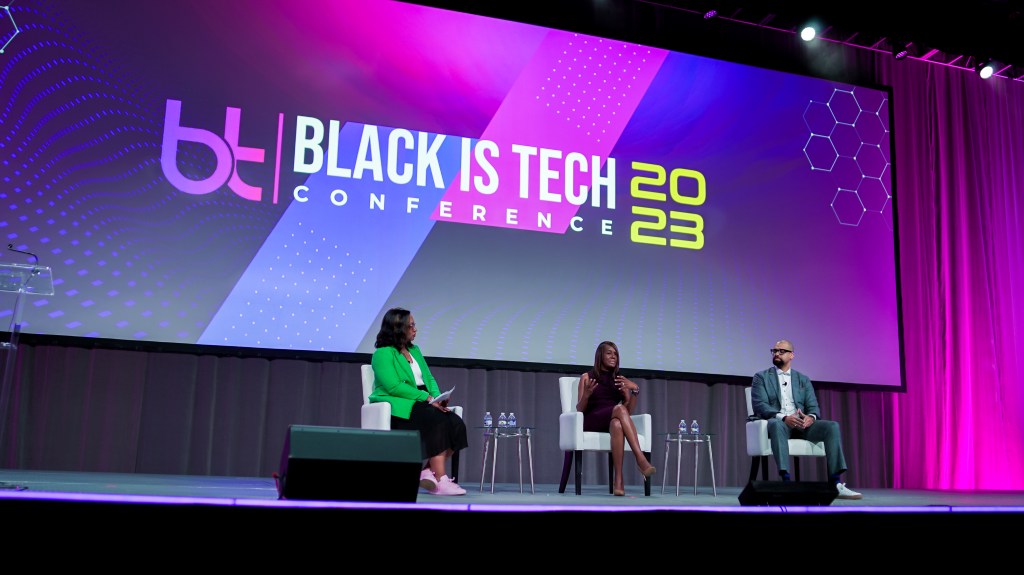
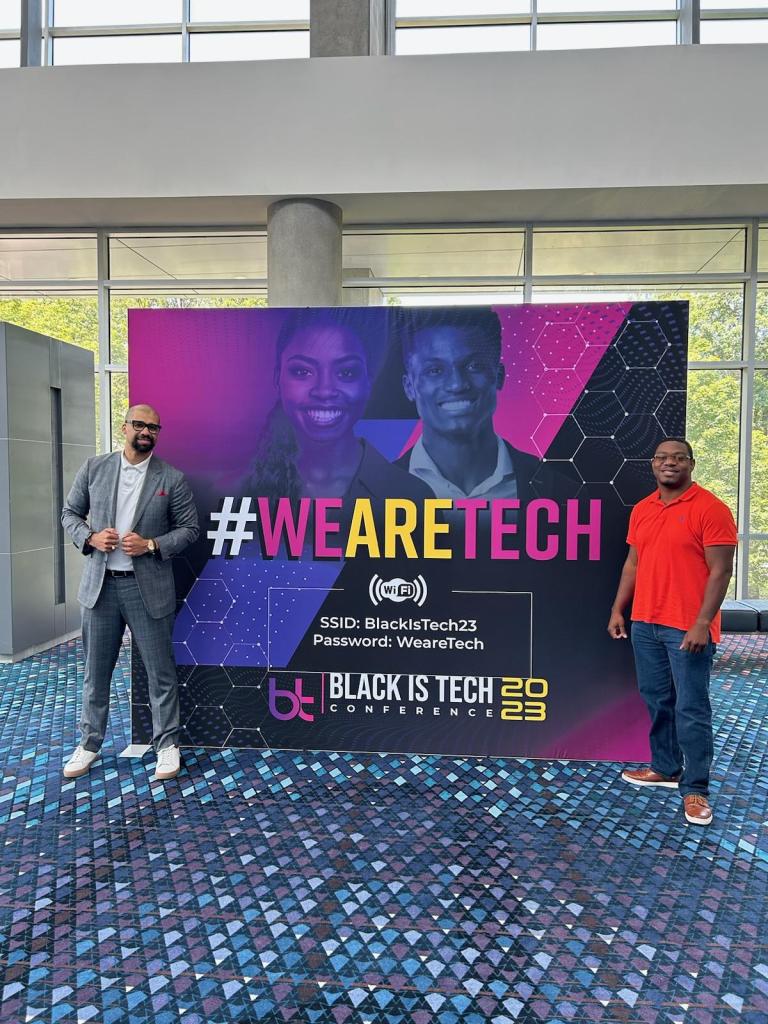
I had the great fortune of sharing the stage with Annie Sutton who is a Sr. Director of Analytics at Microsoft. Upon arriving at the GWCC and gazing at the conference’s main stage, we were awestruck by its size.
Once we were miked up behind the stage curtains and stepped onto the stage, we became the main act. I faced the first question, which was directed at me: “Bias in algorithms and artificial intelligence systems can disproportionately impact minority groups. How can technology companies ensure that the models they create do not perpetuate these biases and instead promote equity?”
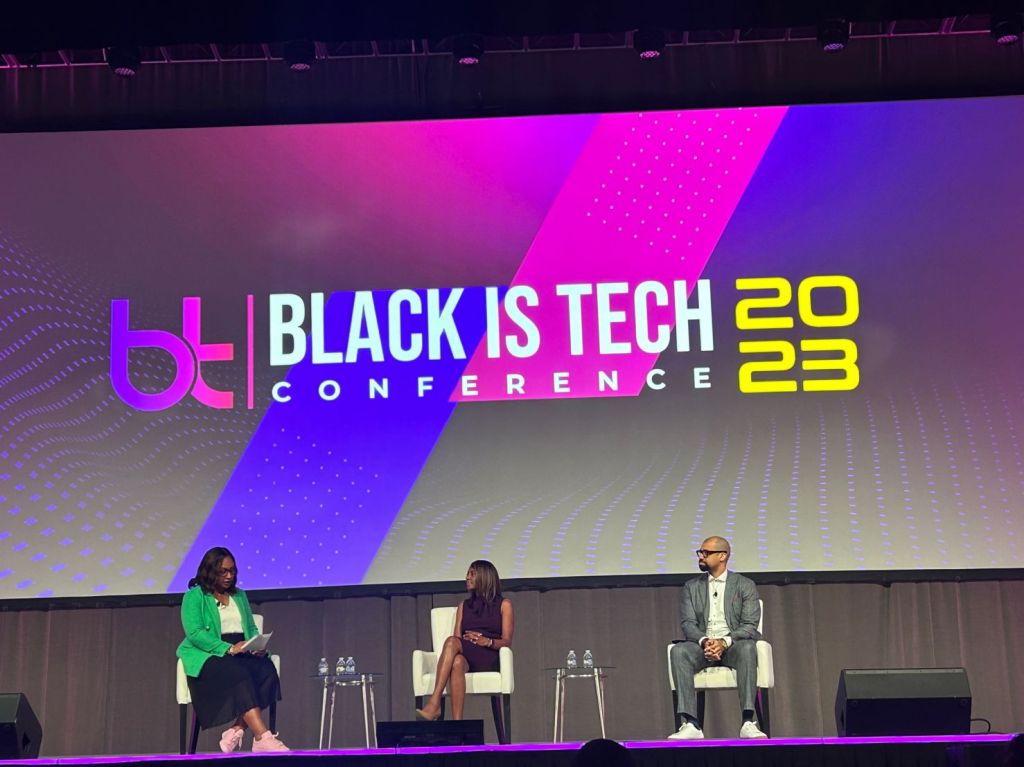
In response, I outlined three key points, which I’ll summarize briefly. Diverse teams are essential for developing models and AI systems, along with the inclusion of diverse data in these models. Additionally, transparency in the operations of these AI models is imperative. We have to let the sun shine in and make these models very transparent. I gave a nod to the work of Dr. Joy Boulamwini (Georgia Tech and MIT graduate) who addresses AI bias issues and ways to counteract them.
The panel addressed various questions, including data literacy, which Annie Sutton addressed so well. I offered an anecdote regarding how I taught my grandmother to use ChatGPT on her iPad to develop rough outlines for her weekly sermons. She is 80 plus years young and still not too old to pick up new data skills to keep up in her profession.
I also fielded a question about Black professionals I follow in the data visualization space. I gave a shoutout to Chantilly Jaggernuath, Tim Ngwena, Chimdi Nwosu, Sekou Tyler and Patrick LeBlanc. Are there others who inspire me? Of course there are, but these were the people that first came to mind.
I believe visible Black role models in analytics are vital for inspiration and challenging the stereotype that success in analytics work is unattainable for us. By sharing our journeys and achievements, we illuminate the possibilities for young Black students trying to enter the data sphere. We’re breaking the stereotype that analytics is a members-only club.
I’m grateful that I can earn a living (a good living, I’ll add) through data and analytics work while using the internet to disseminate my work and tutorials and serving as a positive role model in this field.
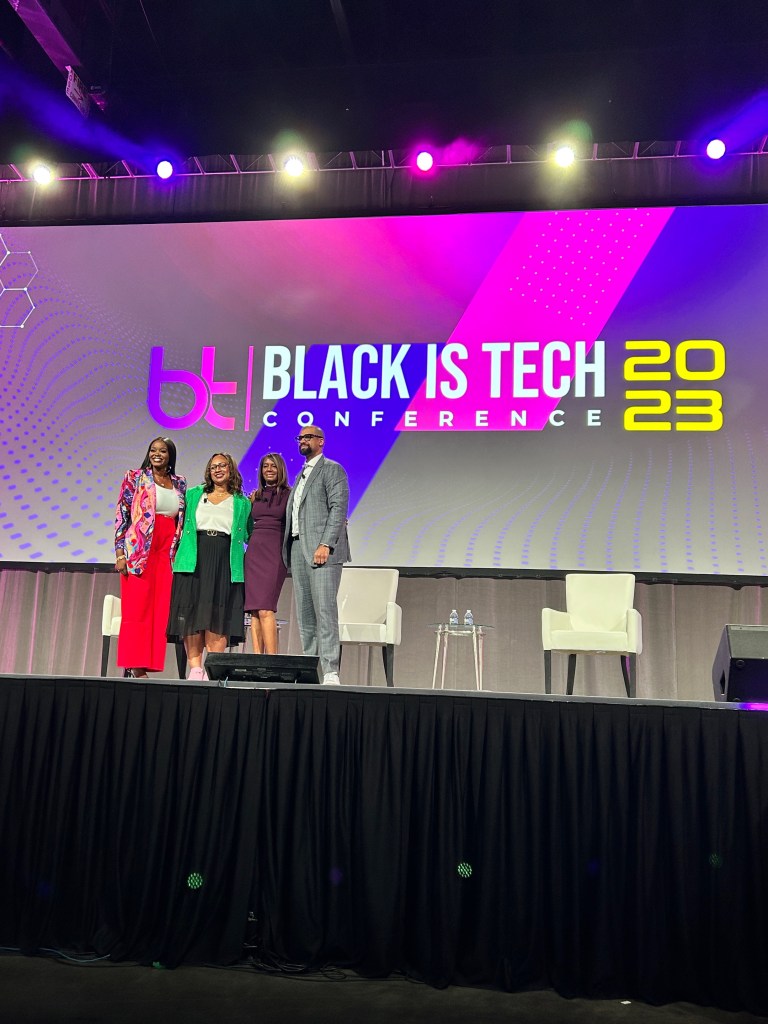
All in all, my experience on the panel at the Black is Tech conference was immensely enjoyable. It’s heartening to experience the significant presence of professionals, entrepreneurs, and creators in the tech realm. Conferences like Black is Tech play a crucial role in meeting the community’s needs.
I appreciate everyone who has supported this blog and my YouTube channel via merch. Please check out the logo shop here.
Stay in contact with me through my various social media presences.
Thank you!!
Anthony B Smoak

