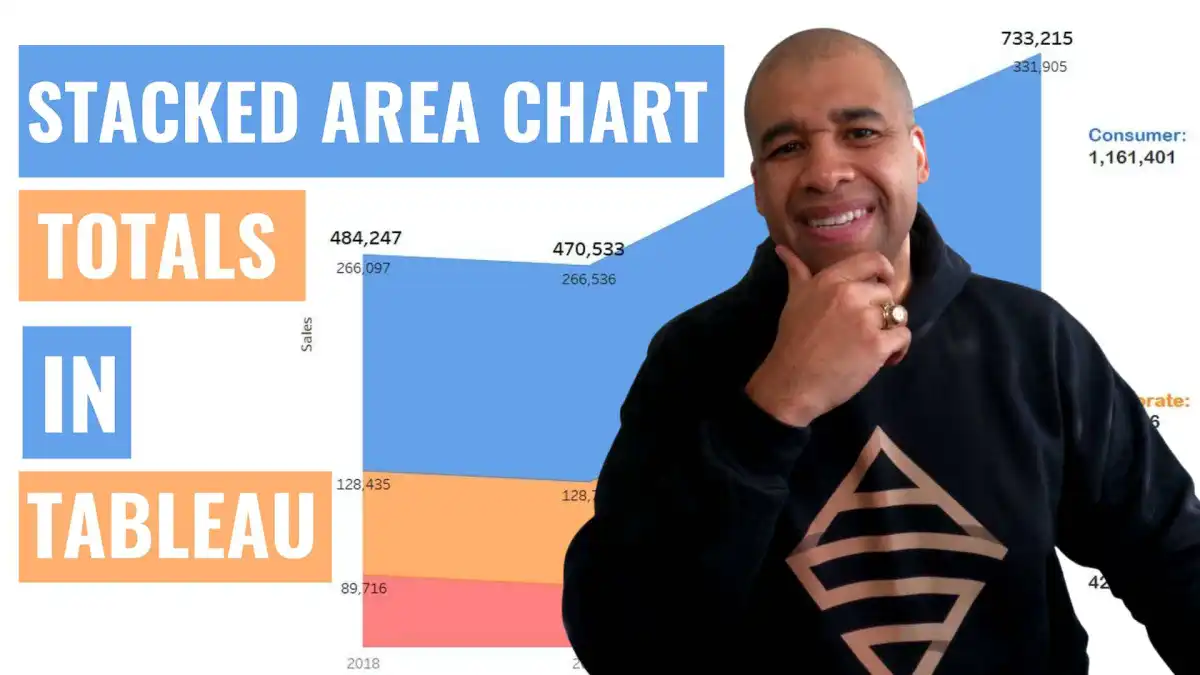
In this video, we’re going to tackle an interesting little challenge – adding dynamic totals to stacked area charts in Tableau. While this may not be a technique for production-ready charts, it’s perfect for those one-time presentations or exports to PowerPoint.
Recently, I had a fantastic 90-minute private data tutoring session with someone who contacted me via this website. During this session, we worked together to address three different data issues, one of which was the quest to display totals for stacked area charts. With some creative thinking and a dash of Tableau magic, I found a solution that I’m excited to share with you.
Use the timestamps below to navigate directly to your desired point in the video.
- 0:43 Intro to Area Chart
- 1:38 Chart Build
- 2:38 Totals by Year
- 4:14 Dashboard Layout
- 5:19 Fixed LOD Formulas
- 6:35 Bonus Tip
If you’re “short” on time and want to see the 1 minute version, I have you covered as well
I appreciate everyone who has supported this blog and my YouTube channel via merch. Please check out the logo shop here.
Stay in contact with me through my various social media presences.
Thank you!!
Anthony B Smoak

