You Don’t Need an MBA to Use Net Present Value

Net Present Value (NPV) and Discounted Cash Flow Analysis (DCF) are financial/MBA wonky terms that may intimidate a majority of people. But in actuality they are simple concepts to understand. Once you realize that a dollar received in the future is worth less than a dollar received in the present, you’re halfway home.

In the words of Benjamin Franklin, “One today is worth two tomorrow.”

Why Should You Care?

The basics of NPV and DCF are not just applicable to CFOs and financial analysts, they’re also applicable to the small business deciding whether to purchase additional equipment, or the person deciding whether to lend money to a friend. These tools help you determine if an investment is profitable considering the time value of money.

If someone offers you $10,000 today, you can immediately invest that $10K in order to start earning money. If someone offers you the same $10,000 one year from now, you have missed a year’s worth of time to take that money and start earning interest.

What is the Discount Rate?

Consider if you will the concept of a “discount” interest rate. If you take your cash and simply invest it at this “discount” rate, you will have earned some return.

What is the discount rate you ask? The discount rate (or r) is the minimum rate of return that you require of an investment in order to take action.

  • For example, you believe that $10,000 invested in the stock market today will offer you a 10% return in one year’s time (i.e. $1000)
  • In order for you to consider an alternative option for investing your $10,000, it has to at least return greater than $1,000 in profit (i.e. return higher than the discount rate that you have established)

A Discount Metaphor

In this example, think of money as a collection of items from a high end clothing line that you are considering purchasing. If you buy the clothes today at present value, you are fine with the current price. But if someone tries to offer you the exact same set of clothes 1 year in the future for today’s prices, you would demand a discount to compensate for the indignity of wearing outdated clothes.

You might have paid $200 for a pair of Jordache jeans and a Member’s Only jacket in 1982, but if someone offered you those items for the same price 36 years later, you would demand a steep discount to compensate for the passage of time. Similar to cash received at a future date, the clothes are valued less the more years you move into the future.

Members Only

Are you still a member?

Receiving $10,000 5 years in the future is not the same as receiving $10,000 today. You would need to discount that $10,000 future payment to reflect the passage of time. Applying your selected discount rate of 10% to the $10,000 received 5 years in the future, you would value that money at $6,209.21; i.e. $10,000/(1+0.1)^5. Don’t worry about the math yet.

If someone ever asks you for a $10,000 investment today only to repay you $10,000 in 5 years, please decline because you would be losing money. The $10K received 5 years in the future would be identical to $6,209 received today. This is because you can immediately invest the $6,209 today and let it compound for 5 years at 10% per year, and have the same $10K in 5 years’ time. Hopefully I haven’t lost you.

Here Comes the Math, Don’t be Scared:

Present Value Example:

  • $10,000 in Present Value * 1.1 = Future Value of $11,000
  • This is the same as saying that $10,000 today returning 10% interest is worth $11,000 in one year

Alternatively, to reverse the scenario:

  • $11,000 in Future Value / (1+0.1) = Present Value of $10,000
  • This is the same as saying that $11,000 received in one year has a present value of $10,000 at 10% interest

In both scenarios, receiving $11,000 in one year would be identical to having $10,000 today. Like those 80’s Members Only jackets, you are essentially applying a 10% discount off of the $11,000 received one year in the future, in order to value those future dollars in present terms.

Present Value Formula2

FV = future cash to be received in year n

This formula is simply plug and chug. Remember that FV = the dollars you expect to receive at some point in the future (i.e. a future cash flow).

Years

You don’t have to limit yourself to evaluating a cash flow one year in the future. The variable n is used in this formula to represent the number of years in the future that you wish to evaluate money received.

Present Value with Years:

  • $10,000 in Present Value * 1.1 * 1.1 = Future Value of $12,100 in two years’ time.
  • This could also be expressed as $10,000 * (1.1)^2 = $12,100 where 2 represents the number of years in the future.

This is the same as saying that $10,000 today at 10% interest is worth $12,100 in two years.

Alternatively, to reverse the scenario:

  • $12,100 in Future value / (1+0.1) / (1+0.1) = Present Value of $10,000.
  • This could also be expressed as $12,100 / (1+0.1)^2 = Present value of $10,000

This is the same as saying that $12,100 received in two years has a present value of $10,000 today at 10% interest.

Net Present Value Scenario (Rolling in NPVs)

Now that you have an understanding of Present and Future Value, we can broach the concept of Discounted Cash Flow analysis or DCF. Again, don’t let the fancy wording intimidate you. This is simply a way of applying the Present Value formula we learned above to multiple cash flows (i.e. money that you receive at different years in the future).

Suppose that you are a financial analyst at the very prestigious Wu-Tang Financial investment firm. At this firm, cash rules everything around you so you have to make the right decisions in order to maintain your job. The firm is considering the following option in regards to investing its money and they’ve come to you for a breakdown of the analysis after firing the last financial analyst.

  • Option 1: The firm is considering investing $10K in a Brooklyn Zoo. This option requires a $10K upfront investment and pays out cash flows as follows over the course of 5 years

NPV

In our example, the firm invests $10K today (i.e Year 0) and receives $2K in one year, $3K in two years, $4K in 3 years and a final payment of $3k in 4 years’ time. The initial $10K investment is represented as a negative number to indicate that it is a payment and those funds are no longer available to the investor.

The previous financial analyst would have simply added all of the cash flows together and determined if the sum of those cash flows were positive. He would have recommended that the firm move forward with the Brooklyn Zoo investment because it returned $2K to the firm over the course of 4 years.

You immediately recognized that this approach does not consider the time value of money. You determine that if the firm were to simply diversify its bonds, it could earn an easy 10% per year on that initial $10K investment. You choose 10% as your discount rate and protect your neck by applying a discounted cash flow analysis.

You proceed to calculate the present value of all of the expected cash flows in the year that they are expected.

Cash Flow 2

With an NPV of -$648.18, this investment is a money loser

By taking the Cash Flow numbers in column B and individually dividing them by (1+.01)^Year, (where .01 represents the 10% discount rate) you were able to calculate the present value (column D) of all the cash flows by the year in which they were received.

For example, the expected $2,000 received in Year 2 is only worth $1,818.18 today. That’s because $1818.18 invested today at 10% interest will produce $2,000 in one year. This same concept applies to the cash flows represented for each year.

By adding and subtracting all of the present values in column D, you’ve calculated the Net Present Value of the Brooklyn Zoo investment (considering you could have earned 10% compounded yearly in an alternate investment).

NPV Formula

When calculating NPV, initial investment is typically a negative number

By evaluating the investment in this manner, you’ve easily determined that a potential investment in the Brooklyn Zoo would lead to a loss of $648.18. If the firm were to simply take that initial $10K and collect 10% interest per year compounded for 4 years, it would have collected an additional $648.18 in profit.

You decide to tell management “Shame on you if you move forward with this investment.”

Summary

Hopefully if you made it this far, the following summary will make sense. If you need to analyze the profitability of a potential investment, take the following steps:

  1. Pick an interest rate as your “discount rate”. Investing your dollars at this rate of return will always be your default fallback option
    • The discount rate (or r) is the minimum rate of return that you require of an investment in order to take action
  2. Calculate the Present Value of all cash flows received in the future (i.e. Future Value) with the following formula:

NPV Formula

  • This method is known as a Discounted Cash Flow analysis. Summing all of the Present Values of Future Cash Flows determines the Net Present Value (NPV) of the investment
  1. If the NPV returns a positive number, then this initiative should be pursued as it provides value over and above dollars invested at the discount rate of return
  2. If the NPV returns a negative number, then the initiative should not be pursued as it subtracts value in comparison to the same dollars invested at the discount rate of return. You should instead invest your dollars at your initial discount rate.

Tableau NPV Dashboard

If you follow my blog, you know Tableau has to figure in to my post somehow. Here is the sample dashboard used at Wu-Tang Financial to present the results of our Brooklyn Zoo NPV case. The bar chart discounted values or present values are highlighted in yellow (e.g. $1.8K, $2.5K, etc.), while the expected future cash flows are a muted color and labeled above the present values. As you change the Discount Rate Parameter slide, the NPV is recalculated and the bar charts are updated.

Feel free to download and/or interact with it on Tableau Public.

Dashboard 2

Always remember, as with any analysis, the results are only as good as the inputs!

Header Image Copyright: photonphoto / 123RF Stock Photo

Advertisement

Airborne Express & The Evolution of the Air Express Industry 1973-2002

Once again, I’m digging into my digital “crates” to share a brief writeup from my time in business school. This HBR case analysis deals with Airborne Express and the Air Express Industry. I composed this writeup for strategy class back in February of 2007; one year before the organization ceased operations in the United States. Airborne Express was once a low cost alternative to the FedEx-UPS duopoly and was eventually acquired by the parent company of DHL Express in 2003. DHL Supply Chain as of 2017 is the 4th largest supply chain and logistics company in North America [1]. Although DHL is a market leader in various countries internationally, the company could not find success with the Airborne Express acquisition in the United States. After five years of trying to make inroads, DHL shut down Airborne Express in 2008 and eventually lost 10 billion (USD) on the venture [2].

History and Development of the Industry

The majority of the freight industry circa 1973 was constituted of the major players in the passenger airline industry. A handful of all cargo airlines most notably Flying Tiger (founded by 10 pilots from the famous WW2 volunteer fighter unit), also participated in this space [3]. The dynamics of the industry were soon changed by Fred Smith Jr. and Federal Express. While a student a Yale, Smith envisioned “that as companies relied more on computers and technology, they would want to keep their equipment working without creating a huge inventory of parts.” [4] Federal Express pioneered the hub and spoke route system. The central hub was located in Memphis and the “spokes” were the routes between Memphis and the cities that Federal Express served. The model proved to be a success due to its many efficiencies and new entrants into the industry copied this operating process.

As federal regulations were relaxed on the air cargo industry, all-cargo carriers began to increase their route structure. The result was a substantial withdrawal from all-cargo flights by the major airlines and an increase in demand for next-day package delivery services.

The Eighties: Rapid Growth and Low Returns.

Despite the rapid growth in the air express industry during the nineteen eighties, profit margins were declining. Federal Express needed to be aware of the strong competitive force represented by UPS’s potential entry into the overnight delivery industry. UPS decided to enter the industry in 1982 and by 1984 “it had a daily volume of about 175,000 packages for its overnight and second-day service, compared with about 290,000 packages for Federal Express.” [5] UPS’s aggressive push into the industry included a strategy to compete on price and offer overnight parcel services at prices that were half that of other industry players. In 1987 Federal Express further shocked the industry by initiating price cuts on its overnight service [6]. The move was designed to preempt expansion by UPS into this space. Brazen price discounting increased the rivalry amongst established firms and inevitably led to reduced profitability in the industry.

Another threat to industry profitability came from the strong competitive force represented by the bargaining power of buyers. Powerful buyers in an industry can squeeze profits out of that industry. Major corporations that utilized the air express industry began to pool together and leveraged their purchasing power to bargain for more price reductions. “To bag a three-year deal as International Business Machines Corp.’s primary U. S. overnight carrier, Airborne Freight Corp. dangled discounts as much as 84% below Federal’s rate card. With price-cutting of that magnitude, it’s clear why a 34% jump in volume produced only 13% more revenues for the air-express industry in the first half of 1987.” [7]

Furthermore, new technologies during this time were seen as a threat to industry players. Due to the burgeoning popularity of the fax machine during the eighties, financial analysts were predicting that they could eventually displace 30% of Federal Express’s overnight-letter shipments [8].

Rising Prices in 1989

The industry during this period of time had just emerged from the shakeout phase and was entering the mature phase of the industry life cycle model. Purolator Courier, Emery, CF Air Freight and Flying Tiger had either been acquired or were marginalized due to poor operational efficiencies. As a result the industry was dominated by a small number of companies. After many years of trying to take share from FedEx and Airborne Express, UPS recognized that the market had matured at this point in time. During the mature stage of the industry life cycle model companies tend to reduce the industry competition and preserve industry profitability. UPS for the first time since it entered the air express market in 1982 began to raise prices on its next day air service. UPS wanted to convey to the rest of the industry that the price war was over. Price signaling was clearly utilized to influence the rest of the players in the industry to raise their prices. Federal Express and Airborne were more than happy to implement a tit-for-tat strategy and thus raise their prices. UPS had succeeded in raising industry profitability although the upcoming recession rendered this effect short lived.

Airborne Express Strengths and Weaknesses

Airborne Express remains a distant third in the US air express industry in terms of market share. However, the company did manage to survive the industry shakeout of the late nineteen eighties due to its distinctive competencies and low cost structure. (See Figure 1)

One of the company’s main strengths is its low cost structure relative to its peers. This low cost structure helped Airborne maintain a 16.5 share of the U.S. domestic express market in 2001, roughly the same as in previous years [10]. Airborne’s other strengths include ownership of its own airport, its exclusive grant of a foreign trade zone and its patent on C-containers. In addition, Airborne has very high brand loyalty. It won the Brand Keys Customer Loyalty Award for the parcel delivery category for five years in a row [9]. Brand loyalty is a significant asset as it helps a company retain market share.

In order to compete with its more powerful rivals in the industry, Airborne concentrated on the niche market of high volume corporate accounts. While this strategy provides constant volume it does have its drawbacks. Number one, a predominately corporate customer base will make Airborne much more sensitive to downturns in the economy. Number two, high volume customers are able to drive down prices and can command significant discounts.

Recommendations

Airborne needs to continue to cut its costs and increase its productivity in order to compete with the larger players in the industry. Its operating costs and capital spending were slashed from 368 million in 2000 to 126 million in 2001 [10]. On the productivity side, Airborne has taken positive steps by centralizing its customs brokerage service at its sort facility in Wilmington, Ohio. “This change will improve customer service and provide Airborne with greater regulatory control.” [11] Lower costs and productivity improvements will begin to pay off when the economy rebounds and help place the company in a more favorable position.

Airborne also needs to ramp up its domestic ground services in order to hedge against the shrinking market in high margin overnight deliveries. Domestic overnight shipments fell from 58% of total volume in 1998 to 52% in 2001 [12]. The company needs to be ready to respond to this shift in demand and capture revenues in ground delivery services.

Although airborne needs to maintain ties to its corporate customer base, it also needs to pay more attention to smaller customers. Its GDS service was introduced on a limited basis and was targeted at large corporate customers. This service needs to be expanded to individual customers and small businesses in order to take advantage of the large capital spending Airborne undertook to establish ground services. Increasing the number of shipping kiosks available to individual customers could be established through a strategic alliance with a retail partner. In this manner Airborne can compete with the Fedex/Kinko’s and UPS/Mailboxes Etc partnerships.

References

[1] Transport Topics: http://www.ttnews.com/top50/logistics/ (retrieved May, 13, 2017)

[2] http://content.time.com/time/specials/packages/article 0,28804,1855948_1864555_1864556,00.html (retrieved May, 13, 2017)

[3] http://www.answers.com/topic/flying-tiger-line

[4] Miller, Karin. “FedEx founder favors ‘Buck Rogers Ideas’” Fort Wayne Journal Gazette. Final Edition (2 Dec. 2001): 1D. Factiva

[5] Rotbart, Dean. “Federal Express Sinks Near Its 52-Week Low, And ‘Buy’ Recommendations Are Appearing.” The Wall Street Journal (20 Mar 1984): Factiva

[6] Foust,Dean “Top Of The News FEDERAL EXPRESS DELIVERS A PRICE SHOCK — It’s firing the first shot in what could be an industrywide war” Businessweek (30 March 1987): Vol 2991, pg 31. Factiva

[7] Foust, Dean. “The Corporation WHY FEDERAL EXPRESS HAS OVERNIGHT ANXIETY — UPS, facsimiles, and a mature market have it worried” Businessweek (9 Nov 1987): Vol 3025, pg 62. Factiva

[8] Foust, Dean “Cover Story MR. SMITH GOES GLOBAL — HE’S PUTTING FEDERAL EXPRESS’ FUTURE ON THE LINE TO EXPAND OVERSEAS” Businessweek (13 Feb 1989): Vol 3091, pg 66. Factiva

[9] “Air & Express Briefs.” Traffic World Magazine (15 July 2002) Factiva

[10] Putzger, Ian “Airborne Again” The Journal of Commerce Week (11 Mar 2002) Factiva

[11] “Airborne Express Enhances International Express Services” PR Newswire (7 Oct 2002) Factiva

[12] “Moody’s Lowers Airborne Express Senior Notes To Ba1” Dow Jones Corporate Filings Alert (15 Mar 2002) Factiva

AOL Time-Warner: You’ve Got Merger

Most people have fond memories of nineties staple AOL which was purchased by Verizon networks for $4.4 billion in 2015. AOL was a true internet pioneer that provided many customers their first taste of dial-up internet access. After its much ballyhooed purchase of “old media” company Time-Warner in 2000, AOL Time-Warner began a slow decline in popularity as emerging broadband technology cut into its market share. By 2003, the combined company posted a $99 billion dollar loss.

The AOL Time-Warner association finally unraveled in 2009 as Time-Warner was spun off. The AOL Time-Warner merger remains (as of 2017) the biggest in US history at roughly $166 billion dollars. Currently, Time-Warner’s market capitalization is north of $75 billion, while AOL’s is estimated at about $2.5 billion.

Fast forward seventeen years after the merger; communications behemoth Verizon plans to launch a new division called “Oath” which will house AOL and its other media properties. I suppose the name is a reaction to the “fake news” phenomenon which surfaced in the 2016 election cycle. One of Oath’s more prominent holdings includes another nineties staple, Yahoo; which was recently purchased by Verizon for $4.8 billion.

The reason I decided to take this AOL trip down memory lane was to share a brief case write-up I generated back in March of 2007 for an MBA strategy class. The write-up briefly discusses the history of AOL and its fateful merger with Time-Warner. Keep in mind that this perspective is from 2007.

History and Development

The media conglomerate known as AOL Time-Warner was formed when America Online, Inc merged with Time-Warner Inc. on January 11, 2001. At the time of the announcement, Time-Warner was the world’s largest media and entertainment company with revenues of 26.8 billion dollars, approximately 5 and half times more than AOL’s 4.8 billion [1]. This 166 billion dollar marriage of leading companies in content assets and internet distribution was the largest proposed merger ever.

AOL initially began operations as Quantum Computer Services. “In 1985, Quantum began offering a graphical-user interface (GUI) BBS for PCs and soon expanded GUI services to Apple and Tandy computers. [2]” The company was renamed America Online in 1989 and concentrated on providing easy online access to a predominately technically illiterate mainstream audience. By the time of the merger with Time-Warner, AOL had grown to be the nations largest online company with close to 22 million subscribers.

Time, was originally founded by Henry Luce and Briton Hadden with $86,375 borrowed from friends and Yale classmates [3]. Warner Bros. Pictures, Inc was formed by brothers Harry, Allen, Sam & Jack in 1923 [4]. In 1990 Time Inc merged with Warner Communications. The 18 billion dollar merger would allow Time to benefit from Warner’s strong international distribution, while Warner would gain from Time’s strong programming [5].

Flat Rate Pricing

AOL initially employed a two part pricing strategy for access to its services. Members were offered a $19.95 rate for 20 hours use and then charged $2.95 for each additional hour they spent online. AOL at this point in time was subjected to very strong competitive forces in the marketplace. The company had previously stuck to its two part pricing strategy even though it had trouble keeping subscribers because smaller rivals were offering unlimited use of the Internet for a single fee.  When AOL’s second biggest competitor Microsoft attempted to set price with a flat pricing scheme of $19.95 for unlimited access, AOL had to match in order to keep its subscribers from defecting.

The shift in pricing strategy had a tremendous effect on the demand for AOL’s service. The subsequent surge in demand illustrates that the demand for AOL’s services was elastic. The price elasticity of demand for certain products or services is highly contingent upon the number and closeness of the substitutes available. For internet access there were many options that were available to consumers during the mid nineties. Thus if the price of a close substitute were to be reduced, buyers of other products would be enticed to switch to the lower cost option. In AOL’s case, buyers switched to the option that offered the most value for the same price as associated switching costs were negligible. The value associated with AOL was its exclusive content and proprietary network in addition to broader internet connectivity. Competitive flat rate pricing along with AOL’s strong brand reputation and a highly elastic demand helped increase its subscriber base and kept its current subscribers from switching to Microsoft’s rival MSN service.

AOL’s Quest for Bandwidth

In the late nineties AOL realized that consumers in the future would demand higher speed connectivity to online content. Unfortunately the only service that AOL offered at this point in time was low bandwidth connectivity via dial-up. The company was at an inflection point where it could decide to stay with a maturing technology or invest in ways to stay competitive as the internet connectivity landscape transitioned. Several high bandwidth options were in the running to become the dominant technology of the future. Of these technologies, access via cable modems using the coaxial cable used to transmit TV signals looked to be the most promising. AOL realized that it would have to develop new strategies to stay competitive in the upcoming high growth mass market populated by the early majority of cable modem users.

AOL’s competitors, Microsoft and AT&T, made significant investments or outright purchases of existing cable operators. As a prerequisite for the acquisition of TCI by AT&T, AOL lobbied the FCC to force TCI to open its cable networks to rival ISPs. “Predictably, this proposal did not sit well with cable operators, especially since they have spent billions on infrastructure upgrades to sell their own Internet-over-cable services.” [6] This strategy proved to be unsuccessful for AOL so predictably the company forged ahead with plays in other broadband categories such as satellite and DSL technologies. Strategic alliances with Hughes Electronics, Bell Atlantic and SBC Communications allowed AOL to hedge against a proliferation in broadband connectivity.

 Strategy Behind the Merger

In theory, the merger of AOL and Time-Warner would allow both companies to realize substantial synergies. According to Steve Case, “We will draw on one another’s strengths, combining AOL’s superior distribution capacity and Internet expertise with Time-Warner’s programming and cable network assets,” [7]. The combined conglomerate would give the new company unprecedented reach across traditional and new internet media. As an example, the conglomerate could offer a multimedia package to advertisers encompassing AOL’s internet offerings and Time-Warner’s traditional media properties. In addition AOL would finally gain access to a cable network allowing it to provide high speed access via the promising coaxial cable method.

Another justification for the merger was the expected costs savings that the new company would realize. For example,” AOL will also be able to shave significant customer acquisition costs by taking advantage of Time-Warner’s vast CD music printing business. One of AOL’s most expensive marketing costs is outsourcing the pressing of its software CDs, which are sent to prospective customers. “ [8] AOL Time-Warner would be presented with bundling opportunities as hit music CDs could contain AOL marketing material and software.

 Beyond 2002

Two years after the historic merger with Time-Warner, AOL’s advertising revenue has dropped and its subscription growth has slowed. As the internet landscape has moved towards broadband, AOL still heavily relies upon dial-up service. A key problem for AOL at this juncture is how to keep users from defecting when they switched to high speed access over cable modems? AOL most concentrate on enriching its content to remain a viable player in the internet landscape. “Content, broadly defined-from downloading music and films to exclusive movie and news clips to prime-time series previews (“The Sopranos” and “Friends”) to the pages of Time magazine-also will be the catalyst that entices dial-up, narrowband subscribers to the more lucrative broadband front as AOL transforms itself into the HBO of the Internet.” [9]

Secondly AOL Time-Warner should concentrate on acquiring more cable operations in order to increase the reach of its broadband services. In 2002 Cablevision was selling at about 25% of its value and Adelphia has indicated that it will sell some of its best cable assets as well [10].

References

[1] Sutel, Seth. “Time Warner being acquired by AOL for about $166 billion”  Associated Press Newswires (10 January 2000): Factiva

[2] http://www.historyoftheinternet.com/chap5.html

[3] http://money.cnn.com/2000/01/10/deals/aol_warner/timeline.htm

[4] http://en.wikipedia.org/wiki/Warner_Bros.

[5] Coy, Peter. “Time Inc. and Warner Communications Merge” The Associated Press. (4 March 1999): Factiva

[6] “Coax Access Fight Goes Regional City Councils Weigh TCI-AT&T Merger” ISP Business News Vol. 5, Issue: 3 (18 January 1999): Factiva

[7] Auchard, Eric “FOCUS – AOL, Time Warner agree to world’s biggest merger.” Reuters News

By Eric Auchard (10 January 2000): Factiva

[8] Cho, Joshua “AOL-TW Synergies Meet with Skepticism.(Company Business and Marketing)” Cable World Volume 12; Issue 11 (13 March 2000): Factiva

[9] Mermigas, Diane “AOL and ABC should emphasize content” Electronic Media Vol: 21 Num: 48 (2 December 2002): Factiva

[10] Gilpin, Kenneth “Cable Industry Plays Catchup” The New York Times (19 May 2002): Factiva


Michael Porter’s Generic Differentiation Strategy Explained

I previously touched upon Michael Porter’s generic cost leadership strategy here. Porter asserts that a business model can’t offer the best product or service at the lowest price and maintain a sustainable competitive advantage. An organization employing a strategy that attempts to be “all things to all people” will become stranded in mediocrity (i.e. earn less than industry average profitability).

A differentiation strategy advocates that a business must offer products or services that are valuable and unique to buyers above and beyond a low price. The ability for a company to offer a premium price for their products or services hinges upon how valuable and unique these offerings are in the marketplace. A differentiator invests its resources to gain a competitive advantage from superior innovation, excellent quality and responsiveness to customer needs. [1]

“It should be stressed that the differentiation strategy does not allow the firm to ignore costs, but rather they are not the primary strategic target.” [2]

If you could boil the differentiation strategy down to a manageable sound-bite, it would look something like this; differentiation enables a firm to command a higher price.

Starbucks coffee doesn’t taste materially better than offerings from rival Dunkin’ Donuts, but Starbucks has crafted the “Starbucks Experience” complete with intimate environments, sustainable sourcing and mobile ordering to differentiate itself with a cult-like following (i.e. command higher than industry average prices for a commodity item).

Advantages:

Differentiation allows a firm to build brand loyalty, obtain customers who exhibit less price sensitivity and increase its profit margins. As opposed to cost leaders, differentiators are not as concerned with supplier price increases. Differentiators can more easily pass on price increases to their customers because customers are more willing to pay the increases.

Differentiators are protected from powerful buyers since only they can supply the distinct product or service offering. Differentiators are also protected against the threat of substitute products in that a new competitor must invest substantial resources to both match the capabilities of the differentiator and break customer loyalty.

“Differentiation is different from segmentation. Differentiation is concerned with how a firm competes—the ways in which it can offer uniqueness to customers. Such uniqueness might relate to consistency (McDonald’s), reliability (Federal Express), status (American Express), quality (BMW), and innovation (Apple). Segmentation is concerned with where a firm competes in terms of customer groups, localities and product types.”[1]

Risks:

Porter assets that there are risks to the differentiation strategy.

  • “The cost differential between low-cost competitors and the differentiated firm becomes too great for differentiation to hold brand loyalty. Buyers thus sacrifice some of the features, services, or image possessed by the differentiated firm for large cost savings;
  • Buyers’ need for the differentiating factor falls. This can occur as buyers become more sophisticated;
  • Imitation narrows perceived differentiation, a common occurrence as industries mature.”

All differentiators should be on guard for firms that seek to imitate their distinct offerings while never charging a higher price than the market will bear [1].

The differentiation strategy should not be mistaken for providing unique products simply for the sake of being unique; rather the differentiation should be tied to customer demand or willingness to pay.

References:

[1] Hill, Charles. W. L., & Jones, Gareth. R. (2007). Strategic Management Theory. Houghton Mifflin Company

[2] Porter, M. E. Competitive Strategy: Techniques for Analyzing Industries and Competitors. New York: Free Press, 1980.

Picture Copyright:  urubank / 123RF Stock


Strategic Analysis of ADP

To my surprise, one of the more popular blog posts on this site has been my excerpt from an MBA group paper drafted for a strategic management class (MGT 6125) taken back in the Spring of 2007 at the Georgia Institute of Technology.

The class was taught by the esteemed professor of strategy, Dr. Frank Rothaermel who literally wrote the book on strategic management. As part of the class our project group interviewed an executive from ADP (Mr. Greg Secord who went on to become President of ADP Canada), wrote a strategic analysis of the company and then presented our findings to the company (complete with Q&A).

Due to the aforementioned popularity of the excerpt that I authored, I have decided to post the paper in its entirety as written by me and other project members. Please keep in mind that this work was originally submitted on April 23, 2007 so please peruse the information with the proper context in mind. I must give credit where credit is due as this paper was put together by Brent Dutton, John Frazer, Jay Hornback, Kyungrok Jung, Chris Nygren, Anthony Smoak, Tom Whittingham, et.al.

Company Background

Automated Data Processing, Inc. is a company that many people have heard of but may not be fully aware of its value proposition. ADP processes payroll for 1 in 6 Americans [1]. While payroll processing is its core competency, it is not the organization’s only line of business worth highlighting. Tax filing, benefits administration and labor management are just a few of the company’s other services. The purpose of this analysis is to offer a better understanding of ADP as a company. We will offer insight into the functions that the organization performs, how they have maintained success and where they are headed as an organization.

ADP’s corporate culture and structure bolster its internal strengths and contribute to the company’s competitive advantage. In addition, expansion and integration have contributed to ADP’s unmatched growth in the industry. ADP’s business level strategies and unique competencies have also been a contributing factor in its growth. This strategic analysis offers a detailed inspection of each of these growth factors and as well as recommendations that should help foster future growth and success.

Before diving into the current state of the business and its strategy, it is important to understand the company’s past. In 1949, Henry Taub became the sole owner of what would become ADP at the age of 21 [2]. This humble beginning, managing one client’s payroll, would slowly snowball through the 1950s as more companies saw the value from payroll outsourcing. ADP expanded by absorbing “Mom and Pop” payroll processors in major U.S. cities and expanding their local clientele.

In the 1960s, ADP became a publicly traded company and continued its expansion strategy. It developed a Brokerage Services division which provided services for stock brokerages on Wall Street. The 1970s saw further domestic expansion as well as ADP’s first international office in The Netherlands. A new Dealer Services division was created to cater to the inventory and accounting needs of automobile dealers. The decade wrapped up with the creation of Claims Services, another valuable division positioned to automate insurance estimates for insurers.

The growing PC industry of the 1980s posed a serious threat to ADP as many companies could more feasibly perform ADP’s services in-house. However, ADP proved up to the challenge by turning that threat into a strength as they absorbed this new technology into their operations. The company crossed the $1 billion revenue mark in the mid-80s and found themselves in the perfect strategic position as outsourcing became trendy in the 1990s. Into the 2000s, ADP boasts 570,000+ clients, 42,000+ employees and $7 billion+ revenue as they continue to be a leader in the HR outsourcing industry.[3]

Industry Analysis

In order to analyze the industry in which ADP competes, Porter’s Five-Forces Model was applied. In the context of this model the competitive makeup of the employee services industry becomes clear.

Threat of Potential Entrants

The threat of potential entrants is relatively low as the result of significant barriers to entry. These include high switching costs for customers and large upfront capital investment for potential competitors. There is little upside to performing payroll processing correctly and significant consequences for performing it incorrectly. As a result, companies are leery of switching payroll providers, giving new entrants little chance of stealing customers from existing payroll firms and thereby limiting the size of the market for new entrants. A large initial capital investment is also needed to establish the hardware and software infrastructure needed to process high volumes of transactions efficiently and effectively. In addition, an extensive sales force needs to be in place to combat the industries largest substitute.

Substitutes

The threat of substitutes is high, and primarily revolves around the mindset of businesses wanting to process payroll themselves [4]. Some plausible reasons include not wanting to lose control of the financial books or being unaware of the cost savings associated with outsourcing functions like payroll [5]. Other substitutes include ERP software like Oracle and SAP.

On the larger scale there are two Macro-environmental forces that have an affect on the industry as a whole; the Technological and Macroeconomic environments. Technology has not only helped the industry to increase the speed in which it can process transactions, but it has also increased the reach of individual companies. For example, ADP began operations using paper and pen to process payrolls. Later they moved onto calculators, punch cards, and mainframes. The processing power of mainframes increased the number of daily transactions they could process and in turn helped to grow the business.[6]

Lastly, the Macroeconomic Environment can affect the potential of companies to attract new clients and maintain current revenue streams. During an economic downturn companies are less likely to spend capital on nonessential projects resulting in fewer new clients. Also, a reduction in a client’s workforce has a direct relationship to the amount of steady revenue received[7] because a smaller workforce equals fewer payroll transactions processed.

Strength of Buyers

The strength of the buyers in the payroll industry is proportionate to the size of the buyer, or more specifically, the number of employees the buyer has.  Recently, many of ADP’s clients in the fragmented financial services industry have begun to merge and consolidate. In fact, there are 770 fewer such institutions in 2007 than there were in 2000[8]. While this consolidation has not happened yet on a large enough scale to severely impact ADP’s margins, it may do so in the near future if the trend continues.

Intensity of Rivalry

For the first forty years that ADP was in business it enjoyed very little competition in its industry. This was due mainly to the fact that ADP had developed a series of in-house competencies using complex technology such as punch card computers and later mainframes to process their customers’ transactions.  Not many other companies had the expertise to handle this difficult technology efficiently and effectively.  However, the advent of the personal computer and user friendly software such as PeopleSoft greatly lowered technical barriers to entry into the industry. This resulted in the advent of numerous new competitors such as Paychex, Ceridian, and Administaff. Although the payroll industry is still dominated by a few players (ADP and Paychex primarily), the PEO and BPO industries that ADP operates in feature many competitors and intense competition. This has already led to price competition and if it continues will hurt ADP’s profit margins.

SWOT Analysis: Strengths

ADP recorded a robust financial performance for the time period 2004 – 2006. Revenue has increased over the past year at the rate of 10%, operating profits 10%, net profit 29%, and cash flow 14% respectively [9]. This financial strength is the foundation for ADP’s future growth. For this industry with small margins and a high cost of acquiring new business, client retention rate is very important. ADP’s average client tenure is estimated at ten plus years, which exceeds the industry’s average [10]. This has allowed ADP to enjoy very predictable recurring revenue streams. ADP’s broad range of offerings is also a strength. These include computerized payroll, transaction processing, data communications, and IT-based business solutions [11]. ADP can offer substantial scale advantage across all its product offerings, which enables it to cater to a larger customer base. As a main player in the industry, ADP consistently processes difficult, mundane, and high-volume transactions very efficiently at a comparatively low cost. Additionally, ADP has established effective and robust business channels through a highly trained and competent sales force of more than 4000 associates; something that is very difficult for competitors to imitate. On top of that, top management succession has been extremely smooth and has caused very little disruption since the 1950s [12]. Lastly, decentralized organization makes for smoother transitions during M&A periods.

SWOT Analysis: Weaknesses

Increasing consolidation in the financial services industry has resulted in the creation of larger entities with more bargaining power. These larger players have adversely affected the margins of the company. First, for the period of 2004 – 2006, ADP’s return on average assets, investments and average equity were 4.6%, 5.1% and 18.8%respectively. This is significantly lower than corresponding industry averages of 8.4%, 10.2% and 21.6% over the same period. Weak returns indicate the inability of the management to deploy assets profitably and can adversely affect investor confidence[13].

Another weakness is their very high dependence on the U.S. market. ADP earned nearly 83.7% of its revenues from the U.S. market in 2006 [14]. The company has a presence in Europe and Canada, but the comparative revenue is smaller. A domestic concentration of revenues makes ADP vulnerable to adverse market conditions in the U.S. Further, ADP doesn’t have a scale advantage in its international market. Having a relatively small presence in international market makes ADP vulnerable to certain foreign risks – dealing with legal systems, establishing distribution channels, finding trained people for the right position, etc. Lastly, ADP has lost much of its tradition of innovation. ADP had been successful in adopting new technology and in turning technological threats into opportunities. ADP was the first to introduce early computer machines into payroll systems. With the threat of mini-computers and PCs in the 1980s, ADP saw this new technology’s potential for company growth and integrated it successfully [15].  But, as the company grew, it became understandably more conservative in its pursuit of new technologies. As a result, ADP will now typically wait for a new technology to be commercially proven before it will consider adoption. Because the most likely disruptive force in ADP’s industry will come in the form of a new technology, ADP’s lack of product innovation and conservative approach to new technology could prove to be a weakness.

SWOT Analysis: Opportunities

ADP still has room for growth in the Domestic Markets. Current estimates place the small business sector at 10 million companies and of that, ADP only does business with 9% of this set [16].  Similar opportunities exist in the large business sector where ADP services 26% of employees [17]. ADP should also look to up-sale current customers who do not outsource their entire HR department. Finally, ADP needs to continue to evaluate foreign markets like India. As India’s citizens grow their annual salaries, so do the opportunities for ADP to offer their outsourcing products.

SWOT Analysis: Threats

The two primary threats that ADP faces are disruptive technology and both potential and current competitors. Up to this point, ADP has been able to adapt to changes in the technological environment. This includes adapting to the introduction of PCs by offering software solutions that resided at clients’ sites [18]. Potential competitors include companies like IBM, who have large amounts of capital and come from industries with lower expected ROI. Within ADP’s own industry, competitors like Paychex are growing rapidly. Today, Paychex focuses mainly on small size businesses [19].  However, as they continue to grow so does the potential that they will bleed into ADP’s market and become more direct competitors.

Competitive Position

Throughout its corporate history ADP has managed to positively differentiate itself relative to its competitors and achieve and maintain superior profitability compared to the industry average [20]. This is indicative of a sustained competitive advantage. In order to understand how ADP has differentiated itself through its competitive advantage, it is necessary to examine the sources of their advantage and understand how they continually reinforce each other. Though there are certainly numerous factors that have contributed to ADP’s success, probably the three key attributes that fuel its competitive advantage are the firm’s brand equity and reputation, its powerful sales force, and its ability to retain clients.

ADP was founded over fifty years ago and is the longest running payroll/HR company in its industry. This is actually quite a feat considering their industry and the types of services that they provide to their clients. By managing such highly visible, though mundane functions such as payroll, benefits and retirement services, ADP is put in an uncompromising position. If the company performs its job well, no one notices. But if it errs in its performance, many will notice and will likely exhibit a highly (negative) emotional response toward ADP. Therefore, in order to prosper in this “no fail” environment, ADP must continually prove to its clients and potential customers that it is extremely reliable and consistently good. Based on the fact that they have been steadily growing over the past fifty years, clearly ADP has managed to remain reliable. In doing so, ADP has built up major brand equity and is highly regarded in the industry. This solid reputation for consistent performance is the first source of their competitive advantage. The result of ADP’s strong brand and reputation come is its high revenues and solid profits. This puts ADP in a healthy financial position, and ultimately allows them to support a large sales force of over 4000 sales associates [21]. ADP’s large sales force is their second source of competitive advantage.

It is their sales force that allows ADP to have a personal presence in every single deal that they pursue [22] (uncommon in today’s world of web and phone based sales). This results in new business growth beyond that of their competitors and a greater brand equity, reinforcing their first source of competitive advantage. Further, in order to effectively compete with ADP, competitors must be able to finance a large sales force of their own. Not many firms have the capital to do this, which provides a high barrier to entry in ADP’s industry. Additionally, ADP uses its sales force to continually serve the clients that it already has. This ensures that there is always someone to personally handle any issues or meet any requirements that a client may have. Due to this highly responsive and effective service provided to its clients, ADP has enjoyed an average client tenure of over ten years [23]. It is this high client retention level that is their third source of competitive advantage.

Keeping the clients that it earns for ten years or more provides a number of benefits to ADP beyond simple client familiarity. First, it prevents market share erosion – once a client goes with ADP, they are very unlikely to leave for a competing firm. Second, it provides an industry barrier to entry because with fewer potential companies to target (since ADP has walled off a large number of clients already), competitors are less likely to enter the industry. Third, and probably most important, ADP’s lengthy client tenure translates into over 90% of its revenues being recurring. This puts ADP in an extremely healthy position financially because not only does it have guaranteed revenue streams, but it also allows the company to plan financial moves years in advance with an extremely high degree of accuracy. ADP can then use its revenue streams to fund its sales force, which in turn strengthens its brand equity, which in turn helps gain and retain clients.

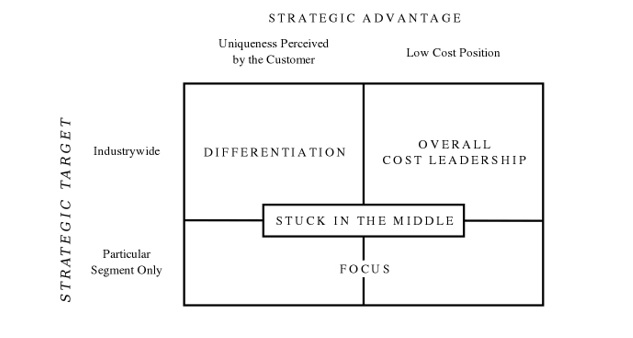
ADP’s reinforcing sources of competitive advantage are very powerful and continue to build upon themselves. These competitive advantages are very difficult to imitate.  This has ultimately allowed ADP to differentiate itself in the industry (See Appendix A). As a result of this differentiation, ADP can charge a premium on its services. This premium is very important in terms of profitability since ADP operates in a relatively low margin industry.

Market Segmentation

ADP has divided their offerings into two main divisions. The primary division is their Employer Services Division that covers all HR offerings as well as the corporate tax services. Employer Services is broken down by company size into three segments for sales purposes. The smallest segment (Small Business Servies) includes all companies with 50 employees or less and represents $0.9 billion in annual revenue [24]. The middle segment (Major Account Services) includes companies that range from 50 employees to less than 1000 employees and represents $1.7 billion in annual revenue [25].

The final segment (National Account Services) is the large employer segment, made up of companies with more than 1000 employees. The National Account Services segment represents $1.6 billion in annual revenue. ADP has strong market penetration in the Major and National Account segments but is currently dealing with slowed growth within these segments. ADP must look to expand into the Small Business segment to grow their market share. This may prove difficult because smaller companies are very price conscious and ADP charges a premium rate for their services. To expand into this price competitive market ADP will have to demonstrate to these companies that it is less costly to outsource payroll and other functions to ADP than it is to do those functions in-house.

Additional revenues in the Employer Services division are gained through ADP’s total source PEO service and product oriented business units. The product oriented business units are comprised of tax, retirement, and pre-employment services. While the PEO service represents only $0.7 billion in annual revenue we feel that this is another growth segment that ADP can focus on. The entire employer services division provided ADP with $5.7 billion in annual revenue in FY 2006.

ADP’s second division is the Dealer Services division which provides multi-purpose software packages for auto dealers. The Dealer Services market is also split into three market segments. The largest segment of the dealer services market is the Domestic Auto Dealers. The second segment represents International Auto Dealers. Finally, ADP’s third segment is the Recreational Vehicle and Commercial Truck Segment. Altogether, Dealer services has 25,500 customers representing $1.6 billion in annual revenues.

Business Level Strategy

ADP has three main business level strategies. The most important strategy focuses on using “solid time tested operating principles”[26]. By utilizing proven operational methods and products for all services ADP is able to provide solid, consistent performance in all market segments. This reliable consistency is especially critical given the nature of ADP’s services. Mistakes in processes such as payroll are highly visible to employees and employers. If ADP were not able to deliver this consistent service their clients would leave in droves. Thanks to ADP’s reliable operations and core knowledge of the transaction services business they can boast over a 90% client retention rate.

The second main business strategy stems from ADP’s decentralized corporate structure. By making decisions at the lower levels of management, ADP is able to deliver superior service to their clients. The flat corporate structure allows for flexibility and incremental improvements in services that are unhindered by bureaucratic obstacles. Because of this, ADP is able to quickly respond to and fill customer needs faster than their competitors. This strategy will become more important as ADP begins to expand into the Small Business segment where customers will have more specialized demands.

The final business level strategy is the direct sales force employed at ADP. By maintaining a sales force of over 4,000 dedicated field representatives ADP is able to include a personal touch on almost every business transaction. As mentioned earlier in the paper ADP’s sales force is seen as a competitive advantage by itself. By saturating the marketplace with well trained, capable sales personnel ADP is able to nurture and capitalize on personal relationships. While this is a competitive advantage it is also extremely costly. The high costs associated with the sales force could be ADP’s greatest weakness in targeting the lower margin Small Business market. Because of this higher cost, ADP has begun to experiment with telephone and web-based sales pitches to target the Small Business market. Using these less expensive marketing channels will allow ADP to quickly and inexpensively contact a greater number of small businesses and hopefully increase their client base within this market.

Mergers and Acquisitions

ADP has become highly successful in its strategy of pursuing growth via horizontal integration. Although current CEO Gary Butler has maintained that ADP has no interest in “large, dilutive, multiyear acquisitions” [27], the company actively acquires smaller industry competitors. Acquisitions give ADP the opportunity to grow inorganically, increase its product offerings, acquire technology and reduce the level of rivalry in its industry.

A perfect execution of this strategy can be seen in its January 2003 acquisition of Probusiness. Probusiness was a much smaller California based provider of payroll and human resources services. Before the acquisition, Probusiness cited eight large competitors who had an interest in acquiring them. An acquisition of Probusiness would give a larger company an opportunity to expand its share of the payroll business [28]. Amongst those eight competitors were notable companies such as International Business Machines Inc. (IBM), Microsoft Corp. and Electronic Data Systems Corp. (EDS) [13]. True to form, ADP decided to react and proceeded to acquire Probusiness. The acquisition effectively prevented large competitors from acquiring approximately 600 new payroll clients in the larger employer space and reduced future competition.

The Probusiness acquisition was also a boon to the company in the fact that it offered ADP advanced payroll processing technology. Probusiness utilized PC based payroll processing as opposed to ADP’s more mainframe based technology [13].

A key acquisition for ADP in terms of increasing its global footprint was the December 2005 acquisition of U.K. based Kerridge Computer. This particular acquisition was significant in the fact that it increased ADP’s Dealer Management Services (DMS) presence from fourteen countries to over forty one [29].

ADP along with its main DMS competitors in the European market, Reynolds & Reynolds and SAP, began to realize the significant growth opportunities for the region. The European market for DMS, unlike the United States market, is much more fragmented which means there are more opportunities for a larger player to standardize product offerings [30]. In 2003 the European Union lifted rules that had previously banned franchised car dealers from selling rival brands [15]. Demand for pan-European systems to help multi-brand dealers manage their stores, sometimes in multiple countries and in various languages increased dramatically [15]. ADP shrewdly realized that many smaller DMS providers would not be able to meet this demand and acquired Kerridge to bolster its position.

Strategically, the Kerridge acquisition has allowed ADP to have first mover advantage over its main competitors with respect to China. New vehicle sales growth in Asia is expected to be at 25.3% by the year 2011 [31]. By becoming a first mover in the region, ADP will have the opportunity to lock customers into its technology since it currently has a 96% client retention rate16. ADP will also have the opportunity to create high switching costs for its customers and make it difficult for rivals to take its customers.

Other recent acquisitions by ADP include Taxware, which brings tax-content and compliance solutions to the table; VirtualEdge, which offers tools for recruiting; Employease, which develops Web-based HR and benefits applications; and Mintax, which provides tools for corporate tax incentives [32].” All of these acquisitions represent small fast growing companies with complimentary products and services. These products and services can be incorporated in ADP’s vast distribution network and provide potential bundling, cross-selling, or up-selling  opportunities with ADP’s current offerings.

Culture, Structure, and Control Systems

Top management at ADP plays an important role in maintaining and advancing the culture created by its founders. The promotion of the core values by top managers sets the tone for the entire organization. ADP stresses the following three core values: 1.) treat everyone with honesty, fairness, and respect; 2.) conduct business with the highest level of integrity; 3.) open, informal communications, hard work, and prudent financial management [33]. Adhering to these values has created a culture of prudent risk taking, continuous improvement, and promotion from within based on ability. As a company that built its core business around delivering first class applications to its client base, maintaining an environment where employees advance their careers based on their ability to improve services is essential because better services lead to higher client satisfaction.  Client satisfaction is the most important metric for client retention, and retention is imperative for a mature company with 46,000 employees and 570,000 clients [34].

Creating incentives for employees to adopt and adapt new technologies will be paramount as ADP begins to embrace the software-as-a-service platform. Collaboration and incremental innovation occur naturally at ADP as a byproduct of its relatively flat, multidivisional organizational structure. As a result managing change during a paradigm shift should be relatively painless for the company. ADP’s flat corporate structure meshes well with its core values and business objectives. ADP avoids excess management layers in favor of decentralized authority and empowered product teams. These empowered associates respond well to this structure as it gives them a better sense of their mission, their accomplishments, and their accountability. Ultimately this leads to happier employees and better service levels [35]. Better service levels lead to longer relationships with ADP, expanded service offerings and more references to other companies who use ADP’s products and services [36].

As mentioned above, ADP advocates incremental innovation and relies heavily on outsiders to produce new products or platforms. Once the benefits of the technology are well known, ADP leverages the new technology to enhance its product offerings. This strategy has fewer risks and lower costs as opposed to investing directly in R&D and innovating internally. Streamlined implementations with aggressive timelines – most are completed in less than one year [37] – allow ADP to catch up quickly and capitalize on the advances along with the first movers. Dedicated cross-functional product teams “live with” the product implementation from its initial project management stages to the final testing and quality assurance phase. These experienced and focused teams deliver new products in half the time of most competitors. ADP also has strategic control systems in place to ensure products continue to meet their high quality standards. The Product Marketing Council and Product Steering Committee meet regularly to evaluate the quality of their products and services in terms of how effectively they meet the client’s business needs and how reliably the applications actually perform. Managers at these meetings also examine industry trends and external product innovations and assess the need to change platforms or introduce new products to ADP.

Recommendations

Over the past fifty years, ADP has a history of planned long-term growth. In the past twelve months, ADP divested their Claims and Brokerage Service businesses. ADP has made a clear strategic focus on the Employer and Dealer Service businesses, part of the new “Fit and Focused” ADP brand. Below are two strategic recommendations for ADP that mesh well with its strengths and the opportunities present in the industry.

Inorganic Growth in Employer Services

ADP has been very successful in matching organic growth with inorganic growth through mergers and acquisitions. Currently, the Professional Employer Organization, or PEO segment of the Employer Services business, is highly fragmented with solid expected growth. In some domestic PEO markets, ADP will be able to grow their presence with their existing ADP Total Source package. New regulations make California a prime market to expand with PEO services [38].

However, the PEO market as a whole is highly fragmented. Currently, over 700 firms provide PEO services to small businesses throughout the US. The overall market penetration of PEO services is about 2.5% with annual growth of about 20%. ADP is in a unique position to grow in this segment because ADP has the largest capital structure (see Appendix B) [39]. ADP could greatly accelerate their growth in this promising market through continued mergers and acquisitions.

Dealer Services in the Booming Chinese Auto Market

As mentioned in latter portion of the Mergers and Acquisitions section, ADP acquired Kerridge Computer which expanded the Dealer Services business internationally. The Dealer Management Service, or DMS, industry will continue to have steady growth in North America and Western Europe. The largest, long-term growth potential, however, is in the Chinese automotive market. The growing economy and shift from institutional vehicle purchases to individual purchases are the primary reasons for a need to increase ADP’s DMS presence in China.

“China’s auto demand is expected to rise to 10 million in 2010, second only to North America,” says Zhang Xiaoqiang, Vice Minister of the State Development and Reform Commission [40].

Currently, the automotive market in China is around 2 million vehicles per year. Thus the projections of the Chinese government equate to 20-30% growth over the next several years [41].

The automotive growth in China also lends to growth in the DMS industry because the Chinese auto market is switching from an institutional sellers market to an individual consumer buyers market [42]. The switch in customer base will put an increased need for dealerships to provide more personalized and generally better customer service. DMS systems can help dealerships manage their business more effectively while focusing more time on building their customer base and nurturing customer relationships. ADP clearly has a focus on the growing Chinese automotive market with its recent announcement with BMW of China [43]. Building on that, ADP needs to continue to focus resources and energy on the great opportunity China’s automotive market provides.

Endnotes

[1] http://www.adp.com/employer_services_overview.asp?iid=EFI0483

[2] Kanarkowski, Edward J., ADP 50th Anniversary Book, Automatic Data Processing, Inc., 1999.

[3] http://www.adp.com/employer_services_overview.asp?iid=EFI0483

[4] Secord, Greg, VP of Marketing, ADP NAS, 30 March 2007 (verbal conversation)

[5] Secord, Greg, VP of Marketing, ADP NAS, 30 March 2007 (verbal conversation)

[6] ADP, 50th Anniversary : 1949 – 1999, p.5. p. 14

[7] Secord, Greg, VP of Marketing, ADP NAS, 30 March 2007 (verbal conversation)

[8] Automatic Data Processing, Inc. Company Profile, DataMonitor, p. 8.

[9] Automatic Data Processing, Inc. Company Profile, DataMonitor, p. 5.

[10] Secord, Greg, VP of Marketing, ADP NAS, 30 March 2007 (verbal conversation)

[11] ADP, Focus on growth : 2006 summary annual report, 2006. http://www.investquest.com/iq/a/adp/fin/annual/index.htm

[12] ADP, 50th Anniversary : 1949 – 1999, http://www.investquest.com/iq/a/adp/main/archives/anniversary.htm

[13] Automatic Data Processing, Inc. Company Profile, DataMonitor, p. 6.

[14] Automatic Data Processing, Inc. Company Profile, DataMonitor, p. 6

[15] ADP, 50th Anniversary : 1949 – 1999, p.5. p. 30., http://www.investquest.com/iq/a/adp/main/archives/anniversary.htm

[16] Rubel, Brian, Sales Executive, ADP NAS, 25 February 2007 (verbal conversation)

[17] Secord, Greg, VP of Marketing, ADP NAS, 30 March 2007 (verbal conversation)

[18] ADP, 50th Anniversary : 1949 – 1999, p.5. p. 30

[19] Paychex 2006 10k report……………………………..

[20]ADP, 50th Anniversary : 1949 – 1999, p.43 http://www.investquest.com/iq/a/adp/main/archives/anniversary.htm

[21] Rubel, Brian, Sales Executive, ADP NAS, 25 February 2007 (verbal conversation)

[22] Secord, Greg, VP of Marketing, ADP NAS, 30 March 2007 (verbal conversation)

[23] Automatic Data Processing, Inc. Company Profile, DataMonitor, p. 6

[24] http://www.investquest.com/iq/a/adp/main/archives/adp031406analyst.pdf

[25] http://www.investquest.com/iq/a/adp/main/archives/adp031406analyst.pdf

[26] http://www.adp.com/about_philosophy.asp#strengths

[27] Simon, Ellen “ADP chief looks at expansion, not acquisition” ASSOCIATED PRESS (7 March 2007)

[28] Gelfand, Andrew “ADP Seen Holding Off Competition With ProBusiness Buy” Dow Jones News Service (6  January 2003) :Factiva

[29] Kisiel, Ralph “Reynolds, ADP aim for European growth” Automotive News Europe Volume 11; Nbr 3 (6 February 2006) :Factiva

[30] Jackson, Kathy “Dealer software market is booming; Multibranding boosts demand for dealership management programs” Automotive News Europe, Volume 11; Number 21 (16 October 2006) :Factiva

[31] ADP Annual Financial Analyst Conference Call Presentation. March 22, 2007

[32] Taulli ,Tom “ADP Tries Getting Even Better” Motley Fool  (November 2, 2006) Accessed 4/14/07 <http://www.fool.com/investing/general/2006/11/02/adp-tries-getting-even-better.aspx.

[33] http://www.adp.com/about_philosophy.asp, “OUR BUSINESS CULTURE”

[34] Automatic Data Processing, Inc. Company Profile, DataMonitor, p. 6

[35] http://www.adp.com/about_philosophy.asp, “ORGANIZATIONAL STRUCTURE”

[36] Automatic Data Processing, Inc. Annual Financial Analyst Conference, “Strategic Growth Program”, Slide 16, March 22, 2007

[37] Notes from meeting with ADP executive on 3/30/07

[38] ADP. (2007). 2006 Annual Report. Retrieved March 24th, 2007 from http://www.investquest.com/iq/a/adp/fin/annual/index.htm

[39] Gordon, Benjamin and Gordon, Matt, “The PEO Industry in Transition,” HRO Today, June 2006.

[40] Gluckman, Ron, “Shifting into High Gear,” The Silk Road, April 2004

[41] Lienert, Dan. “The Rising Chinese Auto Market,’Forbes.com, December 2003.

[42] Hemerling, Jim, Jin, David, and Chen, Forrest, “Winning in Today’s Chinese Automotive Market,” The Boston Consulting Group, June 2005

[43] ADP. (2007). ADP Press Release. “ADP Announces Major Contract With BMW China Automotive,” February 2007.

Michael Porter’s Generic Cost Leadership Strategy Explained

Preface:

Back when I was a heads down developer analyst working at General Motors, my mindset was completely focused on being a data expert and techie. At the time I did not have a broader understanding of business concepts and business strategies. Thus, I considered myself a “one dimensional” resource (a very competent one dimensional resource but one dimensional nonetheless). I set out to remedy my blind spots by acquiring business knowledge so I would have an understanding of broader concepts, become less myopic, and position myself favorably in the marketplace against other one dimensional techies (like myself at that time).

Subsequently, it was in business school where I first learned of American academic Dr. Michael E. Porter of Harvard Business School fame. Mr. Porter is regarded as the preeminent thought leader in the area of business strategy and competitiveness.

Generic Competitive Strategies:

I found value in studying and discussing Porter’s framework that defined generic competitive strategies. A generic competitive strategy is a business level strategy that companies adopt in order to obtain a competitive advantage. The strategies are termed generic because they can be pursued by any and every company across a range of industries. The three primary strategies employed in the framework are:

Cost Leadership (low cost structure, e.g. Wal-Mart, Dell, Southwest Airlines)
Differentiation (offering unique product and services for a premium, e.g. Apple, BMW, Starbucks)
Focus (limiting scope to narrow market segments, e.g. local restaurant or local service provider)

These three strategies help contextualize how businesses aim to obtain profits in their respective marketplaces; they also help businesses understand how they can seek new opportunities for advantage. Porter originally emphasized that a company should target only one of the strategies in the framework or risk paying a “straddling penalty” (a la the doomed airline offshoot Continental Lite). Porter later softened his stance in this regard recognizing the benefits of a hybrid approach in some cases.

Cost Leadership Strategy:

This post focuses on cost leadership because it’s the strategy that relates tangentially to IT and the concept of globalization. As IT workers are aware, the forces of globalization have no mercy in their enablement of companies to offshore work in an attempt to lower costs. This outsourcing of IT work to offshore firms is happening at organizations such as Disney, the University of California and [Insert Any Bank Name Here]. Obviously not all technology related offshoring is done in order to focus on a cost leadership strategy but the activity’s initial intent is to lower a firm’s IT cost structure (refer to my post on how IT has to do a better job communicating its value).

Returning to the main point, the cost leadership strategy is employed when a company aims to be the lowest cost producer in the market. Strategic managers in the organization make a concerted effort to lower business costs in order to achieve a competitive advantage. A lower cost structure enables a business to reap higher than average profitability.

Businesses attempting to implement this strategy may aim to increase inventory turnover, lower their wage expenses and/or manufacturing costs, gain bargaining power over suppliers, develop distinctive competencies in logistics, develop low cost distribution channels or any combination thereof. As an aside, I could prattle on ad-nauseam about Wal-Mart and how its technological capabilities provided the organization significant advantages (and I have here: Part 1, Part 2 and Part 3).

Advantages:

When the cost leader and another company decide to compete in the same price range for the same customers, the cost leader will have the inherent advantage because it will reap higher profits due to its lower cost structure. The cost leader will be able to weather the “price war” due to its lower cost structure advantage.

“The cost leader chooses a low to moderate level of product differentiation relative to its competitors. Differentiation is expensive; the more a company expends resources to make its products distinct, the more its costs rise. The cost leader aims for a level of differentiation obtainable at a low cost. Wal-Mart, for example does not spend hundreds of millions of dollars on store design to create an attractive shopping experience as chains like Macy’s, Dillard’s, or Saks Fifth Avenue have done.” [1]

The cost leader also positions its products to appeal to the “average customer”. The aim is to provide the least number of products desired by the highest number of customers. Although customers may not find exactly what they are seeking, they are attracted to the lower prices [1].

Disadvantages:

Since the strategy involves providing the lowest costs, companies must strive for a large market share when employing this strategy. The cost leadership strategy has been linked to lower customer brand loyalty which in turn means that customers can be swayed by lower priced substitutes from other competitors.

Additionally, as technological change enters the marketplace, new competitors can attack cost leaders through innovation thus nullifying the cost leader’s accumulated advantages. For example, Amazon has accumulated substantial knowledge and proficiencies in the online e-tail space and has placed Wal-Mart on the defensive in this arena as Wal-Mart’s expertise is tailored to its brick and mortar assets.

Or as foretold in Porter-speak back in his 1996 HBR article “What is Strategy”,

“A company may have to change its strategy if there are major structural changes in its industry. In fact, new strategic positions often arise because of industry changes and new entrants unencumbered by history often can exploit them more easily.” [2]

References:

[1] Hill, Charles. W. L., & Jones, Gareth. R. (2007). Strategic Management Theory. Houghton Mifflin Company

[2] Porter, M. E. “What Is Strategy?” Harvard Business Review 74, no. 6 (November–December 1996): 61–78.

Header Image Copyright: olivier26 / 123RF Stock Photo</a>

Diagram Image By Denis Fadeev – Own work, CC BY-SA 3.0, https://commons.wikimedia.org/w/index.php?curid=32434551

Andy Grove and Intel’s Move From Memory to Microprocessors

A titan of the technology industry recently passed away on March 21,2016. Andy Grove was instrumental in taking a commodity product such as the microchip and making it a branded must have hardware feature. “Intel Inside” and “Pentium” were on the minds of the majority of PC consumers during the 1990’s. As the beneficiary of Andy Grove’s leadership, Intel was able to sustain high profitability and sustainable profit growth. With the help of a Redmond based operating systems company, the “Wintel” standard won the format wars against Apple and IBM’s OS/2. Regarding Andy Grove and his Intel tenure, the Economist reported, “Under his leadership it increased annual revenues from $1.9 billion to more than $26 billion and made millionaires of hundreds of employees.”

For all of Andy Grove’s successes in the semiconductor market, it was not a forgone conclusion that Intel would ever make the leap into this industry. Most people of my generation who grew up in the 80’s and 90’s are not familiar with the fact that at the time of Intel’s founding, the company primarily produced replacement computer memories for mainframes. Intel first and foremost was founded as a memory company.

An article by Robert A. Burgelman in the Administrative Science Quarterly highlights the processes and decision calculus of Intel executives which led the company to exit the dynamic random access memory (DRAM) market. Burgelman provides key insights regarding the transformation of Intel from a memory company into a microcomputer company.

DRAM at one point in time accounted for over 90% of Intel’s sales revenue. The article states that DRAM was essentially the “technology driver” on which Intel’s learning curve depended. Over time the DRAM business matured as Japanese companies were able to involve equipment suppliers in the continuous improvement of the manufacturing process in each successive DRAM generation. Consequentially, top Japanese producers were able to reach production yields that were up to 40% higher than top U.S. companies. DRAMs essentially became a commodity product.

Intel tried to maintain a competitive advantage and introduced several innovative technology design efforts with its next generation DRAM offerings. These products did not provide enough competitive advantage, thus the company lost its strategic position in the DRAM market over time. Intel declined from an 82.9% market share in 1974 to a paltry 1.3% share in 1984.

Intel’s serendipitous and fortuitous entry into microprocessors happened when Busicom, a Japanese calculator company, contacted Intel for the development of a new chipset. Intel developed the microprocessor but the design was owned by Busicom. Legendary Intel employee Ted Hoff had the foresight to lobby top management to buy back the design for uses in non calculator devices. The microprocessor became an important source of sales revenue for Intel, eventually displacing DRAMs as the number one business.

There continued to be a disconnect between stated corporate strategy and the activities of middle managers during the transition period. Top executives gave weak justifications for the company’s reluctance to face reality and exit the DRAM space; they were emotionally attached to the DRAM business. A middle manager stated that Intel’s decision to abandon the DRAM market was tantamount to Ford deciding to exit the car business!

The demand for Intel microprocessors led middle managers to begin allocating factory resources to heavily produce microprocessors over DRAM. Intel’s cultural rule that information power should always trump hierarchical position power gave middle managers the decision space to make production allocation decisions that overrode corporate stated goals. These actions further dissolved the strategic context of DRAMs.

“By the middle of 1984 some middle managers made the decision to adopt a new process technology which inherently favored logic [microprocessor] rather than memory advances”. By the end of 1984, Intel’s top management was finally forced to face business reality with respect to DRAMs. In order to regain leadership in DRAM, management was faced with a 100 million dollar capital investment decision for a 1 MEG product. Top management decided against the investment and thus eliminated the possibility of Intel remaining in the DRAM space.

It should not be understated that Andy Grove saw a future where microprocessors would become the dominant driver of Intel’s success. He had the foresight to tell his direct reports to “make data based decisions and not to fear emotional opposition”. This was a gutsy call because the culture of Intel viewed DRAM memory as a “core technology of the company and not just a product”.

Andy Grove himself is quoted as saying, “The fact is that we had become a non-factor in DRAMs, with 2-3% market share. The DRAM business just passed us by! Yet, many people were still holding to the ‘self-evident truth’ that Intel was a memory company. One of the toughest challenges is to make people see that these self-evident truths are no longer true.”

Under Andy Grove’s leadership, Intel embarked upon a high stakes technological paradigm shift where either complacency or botched execution could have jeopardized the very existence of the company. Rest in peace Mr. Grove.
References:

Burgelman, Robert A (1994). Fading Memories: A Process Theory of Strategic Business Exit in Dynamic Environments. Administrative Science Quarterly. Vol. 39, No. 1 (Mar., 1994), pp. 24-56.

Raise the Wage: The Minimum Wage’s Effect on the Restaurant Industry

Overview

The popular myth is that the typical minimum wage worker is a young high school student who is looking to earn pocket money in lieu of living expenses. This could not be further from the truth. According to the Department of Labor, “89 percent of those who would benefit from a federal minimum wage increase to $12 per hour are age 20 or older, and 56 percent are women” [9]. Within the past year the US has seen a number of fast food workers strike for a $15 an hour minimum wage. Would this increase be too high too fast? Back in 2007 when the minimum wage was looking to increase from $5.85 to $7.25 per hour, there was much wailing and gnashing of teeth from the restaurant industry. In 2007 I also wrote a small post which examined the possible effect of a minimum wage increase on the restaurant industry. Research studies have exhibited that an increase in the minimum wage would not be such a bad deal for the restaurant industry.

Labor and Prices  

One effect that the minimum wage increase will have on the industry is that labor costs will increase. Understandably, businesses have a strong desire to keep their costs low so they do not impact profit margins. Typically, labor accounts for about 30 percent of a restaurant’s overhead. This number is slightly below what is spent on food so it represents a significant portion of restaurant operating costs. For Darden Restaurants Inc labor makes up about 43 percent of its cost of sales [2]. Over the course of two years the federal minimum wage will increase by 40 percent. Margins in the casual dining restaurant are very slim, so any increases in costs will cut into the restaurants’ bottom line. As a result of the increases in labor costs, restaurants will be forced to raise prices on their goods. For example, Darden Restaurants Inc has adjusted prices in the past in response to state minimum wage increases. These increases were enacted so that Darden can maintain its profit margins.

Economists Daniel Aaronson and Eric French examined government-collected price data to determine the impact of minimum wage increases on prices. They found that “a 10 percent hike in the minimum wage increased restaurant prices on the whole by 0.7 percent, and prices at limited service establishments by 1.6 percent [1].”

The fast food sector of the restaurant industry provides a number of low skilled minimum wage earning jobs. Aaronson and French’s research shows that prices in this sector can expect to increase by 1.5 percent per every 10 percent increase [1]. With the minimum wage expected to increase by 40 percent over the next two years, if Aaronson and French’s model holds then prices will increase 6 percent in some states. Most likely this would occur in states that follow the federal minimum standard rates and those that do not have their own specific state minimums. Fast food chains that do a significant amount of business in states such as Georgia, Texas, Louisiana and Tennessee amongst others, could potentially feel the full impact of price increases. For states that are already above the federal minimum wage the impact could be less severe as these states may choose to not enact any further increases to their minimum wages.

Another consequence of price increases in the fast food sector would be its disproportional effect on the poor since poorer families spend a relatively large fraction of their incomes on such goods [4].

Employment

Aaronson and French in their research have constructed a model that attempts to determine the impact of minimum wage increases on employment. “In a perfectly competitive labor market, the authors find that a 10 percent increase in the minimum wage will result in a 2.5 to 3.5 percent decrease in employment. [1]”

While conventional theory dictates that minimum wage increases lead to higher unemployment levels, a study by David Card and Alan Krueger, two economic professors at the University of Princeton challenged this notion. They believe that the U.S. is far below the point where wage increases will begin to start costing jobs. Card and Kruegar conducted a study on minimum wage hikes and focused specifically on the New Jersey minimum wage hike in 1990 and its effect on the fast food industry. Unemployment rates and wages were compared in New Jersey and in Pennsylvania. What they found was that “employment actually expanded in New Jersey relative to Pennsylvania, where the minimum wage was constant. [4]”

Card and Krueger repeated this study and focused on the 1996 federal minimum wage increase with respect to New Jersey and Pennsylvania. In this instance the situations were reversed as New Jersey was already above the $4.75 mandated wage and Pennsylvania was increasing its wage from $4.25. They found that greater employment growth occurred in Pennsylvania than in New Jersey. Although they doubted that Pennsylvania’s strong employment growth was caused by the minimum wage increase they believed that the wage increase at worst, did not lead to unemployment as would be expected. “There is certainly no evidence in these data to suggest that the hike in the federal minimum wage caused Pennsylvania restaurants to lower their employment relative to what it otherwise would have been in the absence of the minimum-wage increase. [5]”

 Potential Benefits of Increased Minimum Wage

An increase in the minimum wage will produce some detrimental effects for that industry but there are some benefits to be had as well. I believe that there are employee benefits as well as employer benefits. The employee benefits are those that focus on the pluses experienced by minimum wage workers while the employer benefits are those that actually benefit the restaurants. An employee benefit would be that corporate restaurant chains would be forced to share some of their vast wealth with the people who helped create that wealth. In an economic outlook report issued by the National Restaurant Association they stated that “The industry is heading into 2007 as an economic powerhouse. [6]” The same association has also estimated nationwide industry sales of $536.9 billion next year, up 5 percent over 2006 [6]. With sales of this magnitude it may be feasible to require that more profit be passed on to employees especially since workers need a minimum amount of income to survive and pay bills. At the current rate of $5.15 and hour, “today’s minimum wage workers have less buying power than minimum wage workers had half a century ago. [7]”

Restaurant employers could benefit from the minimum wage increases as well. Card and Krueger studied restaurants in Texas after the federal minimum wage was raised from $3.80 to $4.25. They concluded that job growth was faster at those restaurants which were affected by the increase [9]. Some restaurants were not affected by the increase because they already paid at or over $4.25.

A higher minimum wage could help businesses like Applebee’s and Darden reduce their worker turnover which could increase the level of worker experience and reduce overall training costs. “High employee turnover is destructive to a company because it means that the company workforce lacks experience and continuity; it means that experienced workers have to spend much of their time training new hires; it means that managers have to spend both time and money finding replacements [8]”.

Conclusion

An increase in the minimum wage will mean that restaurants will most likely be forced to increase prices on their offerings in order to compensate for the higher labor costs. But as the article mentions, if prices increase and sales are not affected then fast food restaurant franchisers could reap the benefits of higher royalties. While conventional economics hint that higher wages will lead to higher unemployment, studies by Card and Krueger show that wage increases (at least as they apply to restaurants that rely on minimum wage workers) will not necessarily lead to higher unemployment. Their studies have shown that unemployment rates have fallen in states when the minimum wage was increased. An increase in the minimum wage could also pave the way for increases in restaurant productivity and a lowering of employee turnover.

References

[1] http://www.epionline.org/studies/aaronson_06-2006.pdf

[2] “Darden sees little impact from a minimum wage hike” Reuters News. (20 Dec. 2006) Factiva.

[3] Becker, Gary and Posner, Richard “How to Make the Poor PoorerThe Wall Street Journal (26 Jan. 2007): pg A11. Factiva

[4] http://www.uvm.edu/~vlrs/doc/min_wage.htm

[5] http://www.irs.princeton.edu/pubs/pdfs/90051397.pdf

[6] “UPDATE 1-US restaurants see 2007 sales up, oppose wage hikeReuters News. (12 Dec 2006) Factiva

[7] http://www.businessforafairminimumwage.org/

[8] http://www.huppi.com/kangaroo/41More.htm

[9] http://www.dol.gov/featured/minimum-wage/mythbuster

Lessons from the Japanese Auto Industry

I spent seven years working at Saturn Corporation which was a truly innovative automotive company. Unfortunately, to the chagrin of Saturn-philes, the subsidiary suffered from a lack of sufficient investment from its parent entity, General Motors. Sadly, the defunct Oldsmobile brand was the recipient of funding that should have been allocated to Saturn but I digress. As an automotive industry veteran (albeit on the I.T. and data side of the house), I enjoyed discussions during my days in business school that focused upon the strategy of companies operating within the industry. In an MBA class titled Managing the Resources of Technological Firms (offered at Georgia Tech), our readings concentrated on the challenges associated with managing a firm’s resource capabilities for long-term competitive advantage.

On such article typifying the aforementioned concentration was written by business historian Michael A. Cusumano. In his article Manufacturing Innovation: Lessons from the Japanese Auto Industry which appeared in the MIT Sloan Management Review, Cusumano sets out to debunk the fact that higher productivity amongst Japanese auto firms is a result of the employment of Japanese workers. He aims to illustrate that the merits of innovative processes are the cause for higher productivity emanating from Japanese owned firms.

The article is in essence a summarization of major findings from a five year study of the Japanese auto industry focusing particularly on Toyota and Nissan. It states that some observers of Japan have assumed that Japanese firms copied US manufacturing techniques and then benefited from a better educated and more cooperative workforce. Cusumano attacks this perception by commenting that Japanese run factories located in the United States have demonstrated higher levels of productivity, quality and process flexibility than their domestic counterparts.

Japanese firms who shunned US or European production techniques were able to innovate and improve upon their native processes. Toyota in particular avoided conventional production techniques and decided to focus on developing a tailored system that met the needs of the Japanese market. Other Japanese firms such as Hino, Daihatsu, Mazda and Nissan started to leverage the techniques employed by Toyota and moved away from the US/European traditional process. Toyota and Nissan appeared to have matched or surpassed US productivity levels by the late 1960’s even though their production levels were far less than US automakers.

Cusumano does not share the Boston Consulting Group’s assessment that Japanese management’s emphasis on long term growth in market shares led to an accumulation of experience. He believes that that the emphasis on the accumulation of experience and innovation led to the rise in market share.

Toyota’s legendary Taiichi Ohno realized that firms needed to be flexible when producing small volumes. Three basic policies were introduced during post war Japan’s auto manufacturing era. Just in time manufacturing reduced buffer stocks of extra components and this small lot philosophy tended to improve quality since workers could not rely on extra parts or rework piles if they made mistakes. The second policy was to reduce unnecessary complexity in product designs and manufacturing processes. Nissan and Toyota standardized components across model lines. The third policy involved a Vertical “De-Integration”. In essence, automakers began to build up a network of suppliers for outsourced component production.

US companies stopped innovating by the early 1960’s as they perceived the domestic auto market as mature. The “American Paradigm” from an automotive production standpoint meant large production runs, worker specialization and statistical sampling. The unique market conditions of Japan after WW2 presented an opportunity for Toyota and other producers to challenge convention and become more efficient at much lower levels of production.

Image courtesy of winnond at FreeDigitalPhotos.net

The Competitive Advantage of Process Innovation

This post summarizes a Harvard Business Review article entitled “The New Logic of High-Tech R&D“, written by Gary P. Pisano and Steven C. Wheelwright. The article focuses on the revelation that few companies within the pharmaceutical industry view manufacturing and process improvement as a competitive advantage. The authors assert that manufacturing process innovation is conducive towards product innovation. Companies traditionally spend money on product R&D but tend to neglect focusing on process R&D.

For example, Sigma Pharmaceuticals refused to invest significant resources to process development until the company was confident that the drug would win FDA approval. As a result, when demand for the drug increased they could not meet the higher demand without major investments in additional capacity. During this interim ramp up period the company lost two years of potential sales. Underinvestment in process development on the front end clearly put the company in a sub-optimal position to capitalize on additional revenue.

Process development and process innovation provide a litany of benefits. The first of which is accelerated time to market. According to one drug company, the time required to prepare factories for production generally added a year to the product-development lead time. Senior management was unaware of this fact while the managers within the process development organization were fully aware.

Rapid ramp up is also invaluable because it allows companies to more quickly realize revenue, penetrate a market, and recoup its development investments. Also the faster the ramp up occurs the faster critical resources can be freed to support the next product.

Innovative process technologies that are patent protected can hinder a competitor’s push into the market. Pisano and Wheelwright state that it is easier to stay ahead of a competitor that must constantly struggle to manufacture a product at competitive cost and quality levels.

Process development capabilities can also serve as a hedge against various forces in high tech industries. Shorter lifecycles elevates the value of fast to market processes. Semiconductor fabrication facilities can cost upwards of one billion dollars and depreciate at a rapid pace. For this reason, rapid ramp up is very important. Those companies with strong process development and manufacturing capabilities will have more freedom in choosing the products they wish to develop rather than forced to stick with simple to manufacture designs.

Pharmaceutical companies traditionally operated in the following manner. They delayed significant process R&D expenditures until they were reasonably sure that the product was going to be approved for launch. They didn’t delay product launch by keeping the process R&D off of the critical path. Manufacturing and process engineering were on hand to make sure the company could bring on additional capacity and didn’t stock out. Manufacturing was located in a tax haven even if it was far from R&D and process development, while process development was introduced later in the lifecycle in order to thwart the threat of generic competition. Today however, pharmaceutical companies find themselves squeezed by shorter product life cycles, less pricing flexibility and higher costs.

The article states that the earlier that a company makes process improvements the greater the total financial return. It is costly and time consuming to rectify process design problems on the factory floor. The earlier these problems are found in the development cycle the shorter the process development lead time.

Image courtesy of Areeya at FreeDigitalPhotos.net