Learn GROUP BY vs PARTITION BY in SQL

TLDR

If you are using SQL, you will eventually come across the GROUP BY and PARTITION BY clauses. While the Group BY clause is fairly standard in SQL, most people do not understand when to use the PARTITION BY clause. This easy to understand video uses some NBA season data to make the point very clear! I will show you the best use case of when to apply PARTITION BY.

Bonus content begins at the 10:03 mark, where I demonstrate a use case for the fundamentals I teach you earlier in the video.

The reviews are in, make sure to watch the whole video!

GROUP BY EXAMPLE

To begin, I demonstrate how to use GROUP BY in SQL Server Express to understand basic NBA team statistics based strictly upon the conference. I have to tell the database what to GROUP BY to generate all of the aggregate statistics. I select the conference and want to generate the aggregate sum of points, average points, and max points. I also order the results by the sum of points in a descending fashion.
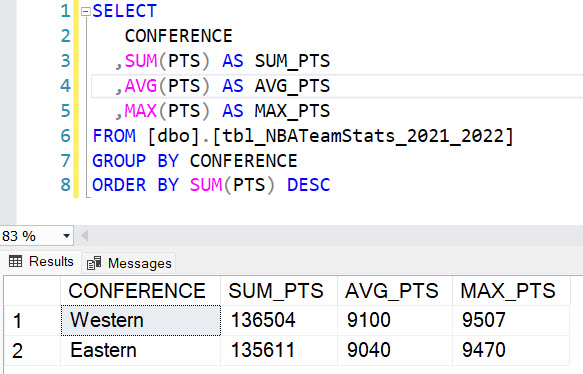
When I run the query, the results show how the data points have been grouped by conference. The results show the sum of points by the two values in the conference field (Western and Eastern), the average points, and the max points. I can also see that there are no individual rows in this result, which is expected when using the GROUP BY clause with aggregate functions like MIN, MAX, SUM, and COUNT.

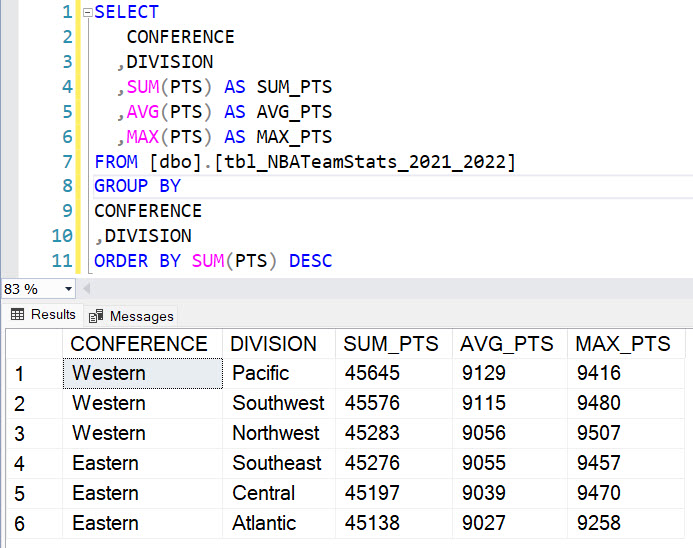
If I want to further break down the results and throw in a division, I need to also select the division field and add it to the GROUP BY statement as well. This action further slices the data points into specific conference and divisions that the teams play in.
PARTITION BY

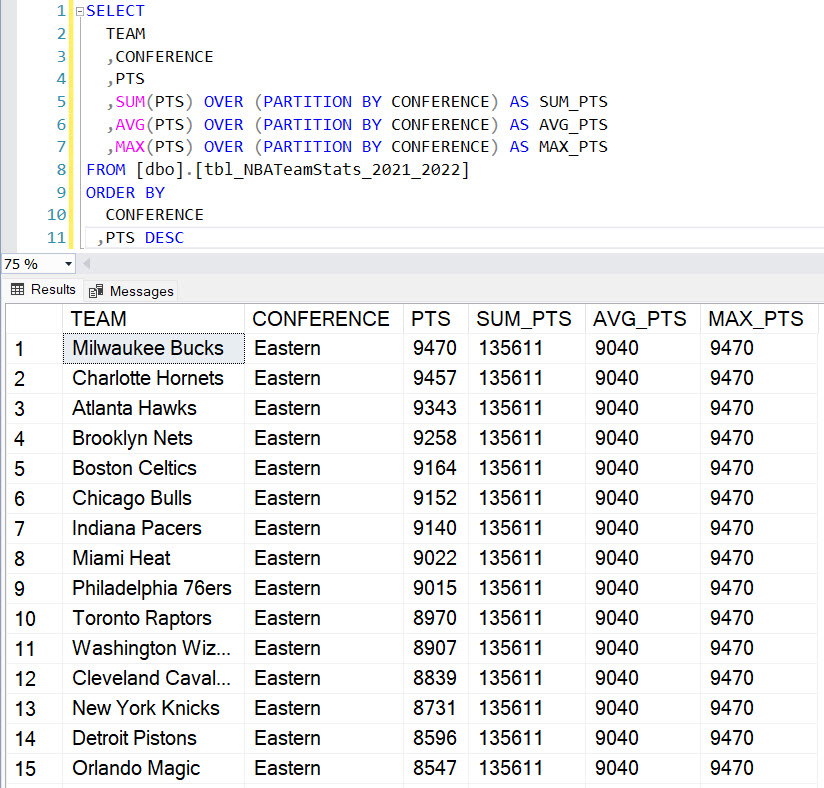
Now, let’s talk about the OVER and PARTITION BY sub-clause. In this next example, I select the conference and bring in the points, which is our measure. Just like with GROUP BY, I sum the points, but I add “OVER” and the sub-clause “PARTITION BY.” This is where the magic happens because I tell SQL what data point to Partition by (i.e., conference) to show the total sum of points by conference.

When I run the query, the results show the sum of points by conference, and I can order the results by individual team points in descending order . The results show a breakdown of the sum of points by conference, but there are still individual rows in the results.
Here is a continuation of the same results for the Western conference teams:
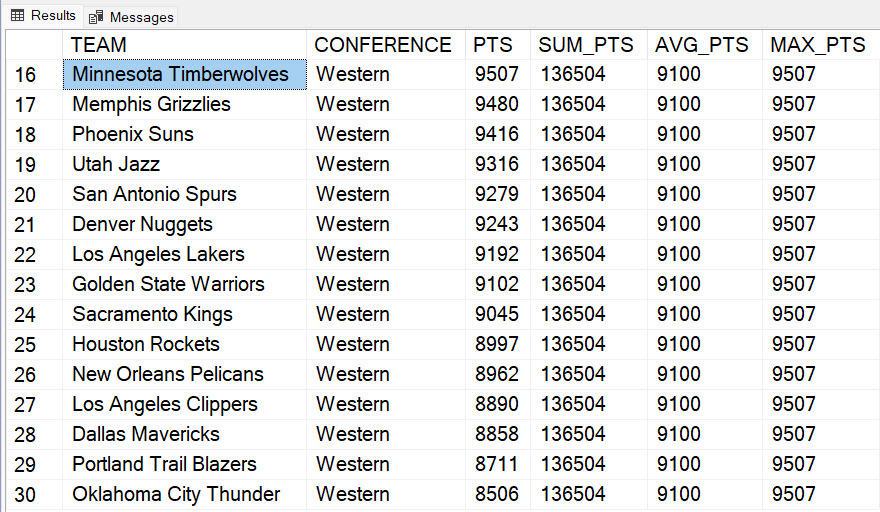
This is an important distinction!! By using OVER and PARTITION BY, I can have data at the most granular level (unaggregated points at an individual team level i.e., the PTS field) combined with data at a higher granularity (points summed, averaged and the maximum points scored at an overall conference level).

The higher granularity of the data at the conference level makes the values for the last three statistics columns repeat (i.e., 135611 for SUM_PTS, 9040 for AVG_PTS and 9470 for MAX_PTS in the Eastern Conference). Similar data is returned for the Western conference.

I’m essentially allowed to have my data cake and eat it too with this best of both worlds approach!

IN SUMMARY

The GROUP BY statement is used to group rows that have the same values in a specific column or set of columns. When used with aggregate functions such as SUM, AVG, MAX, MIN, COUNT, etc., the GROUP BY statement allows us to calculate summary statistics for each group. The result will yield one row for each group. Typically, a GROUP BY statement will reduce the number of rows returned by your SQL.

On the other hand, the PARTITION BY statement is used to divide the data into partitions or subsets based on a specific column or set of columns (like conference in our case). Unlike GROUP BY, PARTITION BY does not reduce the number of rows returned in the result set. Instead, it adds a new column that shows the result of the aggregate function (e.g., SUM, AVG, MAX, etc.) for each partition.

LET PAT BEV COOK

So remember, when it comes to GROUP BY and PARTITION BY in SQL, just like how the Minnesota Timberwolves balanced an effective array of shots to lead the league in total points scored, understanding the nuances of when to use each statement can make all the difference in winning that crucial play-in game against your data! Yes you have to watch the video to understand this reference.

Also, I’m not bad at Pat Bev for going over the top, as this win was against a former employer who recently traded him. Success is always the best revenge!!

Happy querying!!

I appreciate everyone who has supported this blog and my YouTube channel via merch. Please check out the logo shop here.

Stay in contact with me through my various social media presences.

Thank you!!

Anthony B Smoak

Perform Fuzzy Matching in Tableau Prep

TLDR

Life is too short for exact matches!

In this video I will build out a Tableau Prep flow that demonstrates one approach to perform fuzzy matching. We’ll perform the fuzzy matching technique on two lists of companies. One list contains a standardized list and the other contains a non-standardized list, and we will match them together using Tableau’s fuzzy algorithm.

Intro

As a working data professional, one of my main responsibilities is to ensure the accuracy and consistency of the data that I work with. One of the challenges I face is dealing with different variations of company names that may exist in different datasets. In the video above, I walk you through a fuzzy match join that I recently performed using Tableau Prep, a data preparation tool, to reconcile these variations.

What is Fuzzy Matching?

First, I want to introduce you to the concept of fuzzy matching. It’s a technique used to match data when there are slight differences in how the data is presented (most likely as a result of bad data governance). For example, if you have two data sets with company names, one may list a company as “Apple Inc.” while the other may list the same company as “Apple Incorporated.” Fuzzy matching would help you match these two records, even though the names are slightly different.

In Tableau Prep, unfortunately fuzzy matching is not a straightforward process like it is in Excel or other tools like Power BI or Alteryx. However, we can use a workaround to achieve a somewhat similar result. Tableau Prep allows you to automatically group values together using fuzzy-match algorithms that find similar values.

High Level Flow Process

To get started, let’s say we have two lists of companies. One is a master list of companies that we want to use as our reference, or “golden” copy. The other is a list of companies that may be misspelled or unstandardized. We want to join these two lists together using fuzzy matching (although technically we employ fuzzy grouping options to enable traditional matching).

Within Tableau Prep I start with two groups of data, a clean “golden copy” of company names and a list of company names that contain poor data quality (i.e., user-entered data, which may have misspelled or unstandardized company names).

Once we have imported both data sets, we can append them using a union step. The union will combine the two lists of company names into one.

Next, we need to perform a fuzzy algorithm on the list of company names. Remember that both the golden copy and the misspelled names are stacked into one column. In Tableau Prep, we’ll use the fuzzy grouping capability to group together similar values, even if they’re not exact matches. We’ll use this technique to group the misspelled company names with their correct counterparts in the “golden” copy.

Granted this approach does not scale terribly well over a large dataset because we need to eyeball each grouping to ensure it is acceptable, but it is a good start. I don’t know of any fuzzy algorithm that guarantees 100% results, as “fuzzy” is inherent in the name of the approach.

Here are a couple of must read posts from the Tableau Knowledge Base for Fuzzy Grouping if you want to understand these automated grouping options:

After the values in the combined column are grouped together into a standardized clean format, we simply need to deduplicate our values so we are left with a 1 to 1 mapping between the incorrect data and the cleaned up result of the fuzzy grouping. We can use this “translation table” as a means to join our Golden Copy dataset to the less standardized dataset (which has the sales data we need to analyze).

Result

By using fuzzy match and Tableau Prep, I was able to successfully reconcile the variations in the company names and match the sales quotes in the “poor data quality” company names data set to their corresponding IDs in the clean golden copy names data set. If you’re stuck in this kind of a scenario at work, use this process to advocate for a cleanup of the data quality at the source of entry or creation.

In conclusion, fuzzy matching is a powerful technique that can help you match data even when the data may not be spelled correctly or may have slight variations. Tableau Prep may not have a straightforward fuzzy matching feature (a la Excel), but we can use fuzzy grouping to achieve similar results.

Here is a pic of the flow we build in the video. I add additional steps for this unique case but ideally to perform the fuzzy grouping we could stop much earlier in the process.

Additional “Fuzzy” Videos (Not Quality Wise, Topic Wise)

I appreciate everyone who has supported this blog and my YouTube channel via merch. Please check out the logo shop here.

Stay in contact with me through my various social media presences.

Thank you!!

Anthony B Smoak

Use Excel to Connect to SQL Server Data

TLDR

Connect directly to SQL Server data from within Excel. Also learn how to add and modify SQL statements from within Excel and pass them to SQL Server for data retrieval. If you need to quickly refresh data from SQL Server without hassle, then you need to watch this video!!

Intro

As a data professional, I am always looking for ways to optimize my workflow and increase efficiency. One of the techniques that I have found particularly helpful is making a direct connection between Excel and SQL Server. In this video, I will show you how to set up this direct connection and explain the benefits of using it.

What is a Direct Connection Between SQL and Excel?

First of all, let me explain what I mean by a direct connection between these two tools. Typically, when working with data in Excel, you would export the data from SQL Server into a .csv file and then import that file into Excel. This process can be time-consuming and cumbersome, especially if you are working with large datasets. With a direct connection, you can access the data in SQL Server directly from Excel, without the need for any intermediate steps.

What Do I Demonstrate in the Video?

To demonstrate this in the video, I walk you through an example. I am using the Wide World Importers DW sample database from Microsoft, which you can easily import into SQL Server. Within this database, I am looking at the fact.order table, which has over 230,000 rows and many columns. In Excel, I start with a blank sheet and navigate to the Data ribbon. From there, I select “From Database” and then “From SQL Server Database.”

This prompts me to enter a server name and a database name. If you have access to SQL Server, you can find the server name by connecting to the database engine. Otherwise, you may need to reach out to your database administrator to obtain this information (always stay on your DBA’s good side, if you know what’s good for you). Once you enter the server and database names, you can hit “OK” and Excel will work its magic to establish a connection.

At this point, you can preview the data from the table that you want to import. Excel will give you the option to transform the data if necessary, but we’ll just hit “Load.” Excel will then create a connection and query the SQL Server database and load the data directly into Excel. This means that you can always access the most up-to-date version of the data, without having to worry about exporting and importing files!!

Advantages of Connecting SQL and Excel

Now, let’s say that you need to update the data in Excel at a later time. Perhaps you have some ad hoc processes that reference this data and you need to ensure that you always have the latest version. With a direct connection, this is easy to do. You can simply go to the Data ribbon and select “Refresh.” Excel will connect to SQL Server and update the data in your Excel sheet with the latest data from the database.

This is incredibly powerful because it means that you can share your Excel sheet with others without worrying about whether they have the latest version of the data. As long as they have access to the SQL Server database, they will always see the most up-to-date version of the data when they open the Excel sheet.

One thing to keep in mind is that this type of direct connection is best suited for ad hoc purposes!! In other words, you should not use this to create production worksheets that will be used by others. This is because the direct connection is dependent on having access to the SQL Server database. If that access is lost, the Excel sheet will no longer be able to connect to the database and the data will be lost. Therefore, it is best to use this type of connection for temporary analysis and reporting purposes.

Once you have successfully set up the direct connection between Excel and SQL Server, you can easily refresh the data whenever you need it. To refresh the data, all you have to do is go to the Data tab, and click on the “Refresh All” button. This will refresh all the data connections in your workbook, including the connection to SQL Server.

Powerful Excel Functionality (PivotTables and Pivot Charts)

I don’t reference this in the video, but you can also use Excel’s PivotTables and PivotCharts to analyze and visualize the data. PivotTables allow you to group and summarize data in many different ways, while PivotCharts provide a visual representation of the data that is easy to understand. It may be easier for you to manipulate this data in Excel and extract additional insights than in SQL Server.

Financial analysts, in particular, should avoid taking manual inputs from any and everywhere (especially ungoverned data sources) and using this type of refresh for production purposes. As a recovering financial analyst I know your management hates automation and loves when you cut and paste random information from Bob in division finance. I also know they want to see you work 12 hours a day because the CFO needs that monthly IT spend variance to budget!! Please do yourself a favor and meditate hard for serenity every Sunday night.

Conclusion

In conclusion, using a direct connection between Excel and SQL Server can greatly improve your workflow when working with large datasets. By leveraging the full power of SQL Server’s querying capabilities and Excel’s Pivot tools, you can create powerful AD-HOC reports and analyze data in ways that would be difficult or impossible with other tools. Consider setting up a direct connection to SQL Server to streamline your ad-hoc workflow and improve your productivity.

Additional References to Maximize Your Learning

All views and opinions are solely my own and do not necessarily reflect those of my employer

I appreciate everyone who has supported this blog and my YouTube channel via merch. Please check out the logo shop here.

Thank you!!

Anthony B Smoak

P.S. I respect your hustle Financial Analysts. I ask that you respect those who want to make your life easier with report automation!!

Build Dynamic SQL with SQL Server and Excel

In this video you will learn how to use the SQL CASE statement to add “filter flexibility” to your front-end Excel worksheet, thus taking your SQL + Excel skills to the next level. I’ll reveal the UPDATED code I used to build a dynamic SQL statement using SQL Server and Excel.

By using Excel as a tool to pass cell values to SQL Server queries, you’ll be able to generate dynamic SQL statements on the fly, saving time and reducing the risk of errors in your code. Building upon the previous video “Call a SQL Server Stored Procedure using Excel Parameters”, let’s enhance your SQL skills and streamline your workflow.

Here is a screenshot of the front end Excel worksheet we setup in previous videos. This Excel sheet will execute a stored procedure call with parameters supplied from cells on the sheet.

Below is the stored procedure I use to enhance the code from previous videos. I setup a static SQL string that will serve as the base of the SQL statement. I then use the CASE statement to evaluate the cell values incoming from the Excel worksheet (with some slight manipulation for empty and default date values incoming from Excel).

Depending upon those values, the filter clause is dynamically built and appended to the base of the SQL string, which is then executed with the sp_executedqsl command. This command has many advantages with respect to protecting your code from a SQL injection attack.

If you need a breakdown of the code and the worksheet functionality, make sure to watch the video below.

Additional References to Maximize Your Learning

I always have fun creating this type of content and sharing with you, my YouTube channel followers.

Stay in contact with me through my various social media presences.

All views and opinions are solely my own and do not necessarily reflect those of my employer

I appreciate everyone who has supported this blog and my YouTube channel via merch. Please check out the logo shop here.

Thank you!!

Anthony B Smoak