SQL Window Functions – Lead and Lag

The LEAD and LAG window functions in SQL offer the simple yet powerful ability to analyze data beyond the current row. They allow you to access values from rows before and after the current one, without using complex self-joins or subqueries. You can use these two functions to compare values across rows, calculate differences, and perform other operations that require looking ahead or behind in your dataset.

Back when I used Microsoft Access as my main data tool and needed to access information from a previous row to do calculations, I would use VBA coding to implement solutions. At the time, it did not occur to me that I could achieve similar functionality using SQL Server’s LEAD and LAG window functions.

In this highly informative video (if I do say so myself, I’m biased but I’m correct), I show you a use case for the LAG function to calculate the average time for an invoice to move through approver workflow steps. At a high level, this entails subtracting the approval date from a prior row from the current row’s approval date.

LEAD & LAG Window Function Syntax

The LAG window function allows you to access data from a prior row to “look back” dynamically as you query data. This aids calculating deltas, running totals, and more. The syntax of LAG function is as follows:

LAG(column_name, offset, default) OVER (PARTITION BY column_name ORDER BY column_name)

The LEAD window function allows you to access data from an upcoming row to “look ahead” dynamically as you query data. The syntax of LEAD function is as follows:

LAG(column_name, offset, default) OVER (PARTITION BY column_name ORDER BY column_name)

The PARTITION BY clause is key; it that ensures we only look back (or ahead) within a given value in the column_name (for example as shown in the video, an invoice number) otherwise row transitions would provide invalid lookups.

Why Use Lead and Lag functions in SQL?

Using LEAD and LAG functions in SQL can help you analyze your data faster and easier, because you can:

  • Perform calculations and comparisons across rows without using self-joins or subqueries, which can be complex and slow.
  • Avoid exporting your data to Excel or other tools, which can be time-consuming and error-prone.
  • Simplify your code and improve its readability and maintainability.

As I mentioned earlier, if I had known about these two functions years ago when I was trying to access prior values via VBA and loops, I could have saved myself a lot of time, increased my efficiency and made my approach much easier to read in the resulting documentation.

Conclusion

I believe that learning from examples is critical for mastering both logical concepts and SQL syntax. By watching the linked video, you will gain the knowledge to tackle similar problems in your own data analysis scenarios.

Additionally, LEAD and LAG provide simpler, set-based solutions for cross-row data comparisons that would otherwise require procedural coding.

LEAD and LAG functions allow you to merge the past and the future!

I appreciate everyone who has supported this blog and my YouTube channel via merch. Please check out the logo shop here.

If you want to learn all the latest tips and tricks in core data analysis tools, stay in contact with me through my various social media presences.

Thank you!!

Anthony B Smoak

Build Dynamic SQL with SQL Server and Excel

In this video you will learn how to use the SQL CASE statement to add “filter flexibility” to your front-end Excel worksheet, thus taking your SQL + Excel skills to the next level. I’ll reveal the UPDATED code I used to build a dynamic SQL statement using SQL Server and Excel.

By using Excel as a tool to pass cell values to SQL Server queries, you’ll be able to generate dynamic SQL statements on the fly, saving time and reducing the risk of errors in your code. Building upon the previous video “Call a SQL Server Stored Procedure using Excel Parameters”, let’s enhance your SQL skills and streamline your workflow.

Here is a screenshot of the front end Excel worksheet we setup in previous videos. This Excel sheet will execute a stored procedure call with parameters supplied from cells on the sheet.

Below is the stored procedure I use to enhance the code from previous videos. I setup a static SQL string that will serve as the base of the SQL statement. I then use the CASE statement to evaluate the cell values incoming from the Excel worksheet (with some slight manipulation for empty and default date values incoming from Excel).

Depending upon those values, the filter clause is dynamically built and appended to the base of the SQL string, which is then executed with the sp_executedqsl command. This command has many advantages with respect to protecting your code from a SQL injection attack.

If you need a breakdown of the code and the worksheet functionality, make sure to watch the video below.

Additional References to Maximize Your Learning

I always have fun creating this type of content and sharing with you, my YouTube channel followers.

Stay in contact with me through my various social media presences.

All views and opinions are solely my own and do not necessarily reflect those of my employer

I appreciate everyone who has supported this blog and my YouTube channel via merch. Please check out the logo shop here.

Thank you!!

Anthony B Smoak

How to Import a BAK File into SQL Server

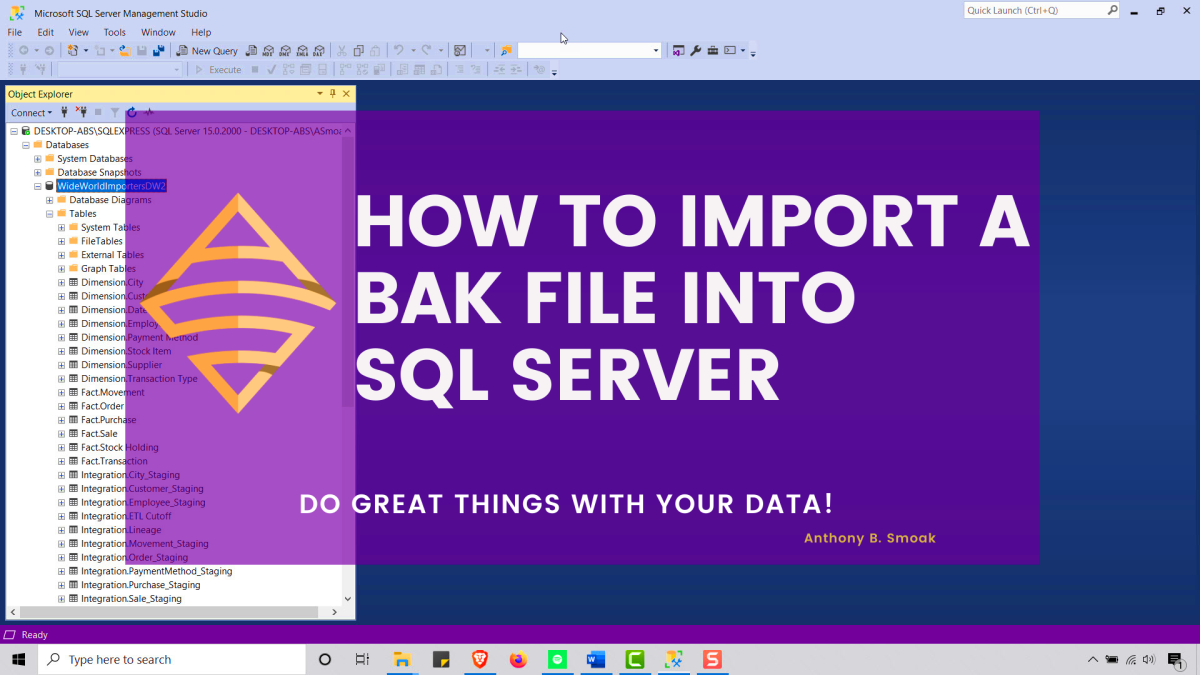
If you’ve ever asked “How do I import a .BAK file into SQL Server” or “What is a BAK file and how do I open it” then this is your video. Additionally, I also demonstrate how to create a .BAK file to backup your database. If you work with data then you need to know this tip!

Do Great Things with Your Data

Anthony B. Smoak

Please like and subscribe on the Anthony B. Smoak YouTube channel!
Definitely pick up some merch if you’ve enjoyed this blog and YouTube channel over the years.

All views and opinions are solely my own and do not necessarily reflect those of my employer.

How to Dynamically Pivot Data in SQL Server


SQL is the lifeblood of any data professional. If you can’t leverage SQL and you work with data, your life will be more difficult than it needs to be.

In this video I am using SQL Server Express to turn a simple normalized dataset into a pivoted dataset. This is not a beginner video as I assume you are familiar with basic SQL concepts.

T-SQL is Microsoft’s SQL language that contains additional functions and capabilities over and above ANSI standards. We’ll use some of these functions to turn the following data set that displays average rents in major American cities into a pivoted denormalized dataset.

The City values in the City column will become individual columns in a new pivoted dataset with their respective Average Rent values appearing underneath.

We’re going to transform this:

Normalized Data

Into this:

Pivoted Data

Notice how the city values are now column heads and the respective Average Rent values are underneath.

Make sure you watch the video but here is the code used in the example.

IF OBJECT_ID('tempdb..##TBL_TEMP') IS NOT NULL
DROP TABLE ##TBL_TEMP

--This parameter will hold the dynamically created SQL script
DECLARE   @SQLQuery AS NVARCHAR(MAX)

--This parameter will hold the Pivoted Column values
DECLARE   @PivotColumns AS NVARCHAR(MAX)

SELECT   @PivotColumns= COALESCE(@PivotColumns + ',','') + QUOTENAME([City])
FROM [dbo].[tbl_Rent]

/* UNCOMMENT TO SEE THE NEW COLUMN NAMES THAT WILL BE CREATED */
--SELECT   @PivotColumns

--Create the dynamic query with all the values for
--pivot column at runtime
--LIST ALL FILEDS EXCEPT PIVOT COLUMN

SET   @SQLQuery =
   N'SELECT [City Code],[Metro],[County],[State],[Population Rank],' +   @PivotColumns + '
   INTO ##TBL_TEMP
   FROM [dbo].[tbl_Rent]
   
   PIVOT( MAX([Average Rent])
      FOR [City] IN (' + @PivotColumns + ')) AS Q'

/* UNCOMMENT TO SEE THE DYNAMICALLY CREATED SQL STATEMENT */
--SELECT   @SQLQuery
--Execute dynamic query
EXEC sp_executesql @SQLQuery

/* VIEW PIVOTED TABLE RESULTS */
Select * from ##TBL_TEMP


Big shoutout to StackOverflow for help with this example.


Return Unmatched Records with SQL and Microsoft Access

Over the course of many years of building SQL scripts, I’ve tended to help SQL novices perform the set difference operation on their data. This post will not provide in-depth coverage on SQL run plans and tuning minutiae, but I do want to provide a high level overview for the novice.

If we define set A as the three numbers {1, 2, 3} and set B as the numbers {2, 3, 4} then the set difference, denoted as A \ B, is {1}. Notice that the element 1 is only a member of set A.

A picture is worth a thousand words as they say. A Venn diagram will be effective at illustrating what we’re trying to accomplish in this post.

Venn Diagram Difference

This blog post will cover using SQL and Microsoft Access to address capturing the shaded records in set A. If you have a database table named A and wanted to determine all of the rows in this table that DO NOT reside in another table named B, then you would apply the set difference principle.

LEFT OUTER JOIN & IS NULL SYNTAX

There are multiple ways to implement the set difference principle. It helps if there is a common join key between both sets of data when performing this analysis.

If I were working with two tables, one containing inventory data and one containing order data. I could write the following SQL script to return all the inventory rows that do not reside in the orders table.

SELECT table_inventories.* 
 FROM   table_inventories 
        LEFT OUTER JOIN table_orders 
                     ON table_inventories.id = table_orders.id 
 WHERE  table_orders.id IS NULL  

MICROSOFT ACCESS EXAMPLE

Consider the following tables in Microsoft Access. Observe that table_orders has fewer records than table_inventories.

Access Example Inventory Access Example Orders

We can construct a set difference select query using these tables to return all of the products in table_inventories that have not been ordered. Create a query in Microsoft Access in a similar fashion as shown below.

Access SQL Difference Join

The result of this query would produce the following two products that are not in table_orders.

Access Example Query Result

The Microsoft Access Query & View Designer would automatically generate the following SQL if you cared to open the Access SQL editor.

SELECT table_inventories.*
FROM   table_inventories
LEFT JOIN table_orders
ON table_inventories.id = table_orders.id
WHERE  (( ( table_orders.id ) IS NULL ));

Notice that LEFT JOIN is automatically created instead of LEFT OUTER JOIN. In Microsoft Access, the OUTER operation is optional. Also notice that Access loves to add additional parentheses for reasons known only to Microsoft.

Per Microsoft Access SQL Reference:

“Use a LEFT JOIN operation to create a left outer join. Left outer joins include all of the records from the first (left) of two tables, even if there are no matching values for records in the second (right) table [1].”

NOT EXISTS SYNTAX

Let’s step away from Microsoft Access for the remainder of this post. The NOT EXISTS approach provides similar functionality in a more performance friendly manner as compared to the LEFT OUTER JOIN & IS NULL syntax.

SELECT table_inventories.*
FROM   table_inventories
WHERE  table_inventories.id NOT EXISTS (SELECT table_orders.id
FROM   table_orders);

EXCEPT SYNTAX (T-SQL)

Alternatively, we could use the SQL EXCEPT operator which would also accomplish the task of returning inventory ids that do not reside in the orders table (i.e. inventory items that were never ordered). This syntax would be appropriate when using SQL Server.

SELECT table_inventories.id
FROM   table_inventories
EXCEPT
SELECT table_orders.id
FROM   table_orders

Per Microsoft:

“EXCEPT
Returns any distinct values from the query to the left of the EXCEPT operator that are not also returned from the right query [2].”

MINUS SYNTAX (ORACLE)

The following script will yield the same result as the T-SQL syntax. When using Oracle, make sure to incorporate the MINUS operator.

SELECT table_inventories.id
FROM   inventories
MINUS
SELECT table_orders.id
FROM   table_orders

Now take this tip and get out there and do some good things with your data.

Anthony Smoak

References:

[1] Access 2007 Developer Reference. https://msdn.microsoft.com/en-us/library/bb208894(v=office.12).aspx

[2] Microsoft T-SQL Docs. Set Operators – EXCEPT and INTERSECT (Transact-SQL). https://docs.microsoft.com/en-us/sql/t-sql/language-elements/set-operators-except-and-intersect-transact-sql

[3] Oracle Help Center. The UNION [ALL], INTERSECT, MINUS Operators. http://docs.oracle.com/cd/B19306_01/server.102/b14200/queries004.htm

Venn diagram courtesy of http://math.cmu.edu/~bkell/21110-2010s/sets.html

B.I. Basics: Create an SSIS Data Profiling Task In SQL Server

Data Profiling is necessary when trying to gain an understanding of a given data set. A data profiling assessment should begin before any reporting or application development work begins. My video will demonstrate how to create a basic SSIS Data Profiling Task using SQL Server Data Tools.

According to the DAMA Guide to the Data Management Body of Knowledge:

“Before making any improvements to data, one must be able to distinguish between good and bad data…. A data analyst may not necessarily be able to pinpoint all instances of flawed data. However, the ability to document situations where data values look like they do not belong provides a means to communicate these instances with subject matter experts, whose business knowledge can confirm the existences of data problems.”

Here is additional information direct from Bill Gates’s former startup outfit regarding the types of data profiling tasks available in SSIS: https://msdn.microsoft.com/en-us/library/bb895263.aspx

If you’re interested in Business Intelligence & Tableau please subscribe and check out my videos either here on this site or on my Youtube channel.