10 Items to Know When Starting A New Data Project

Are you a data professional looking to start a new data project?

Then you need to review my 10-point checklist to make sure you’re on the right track. Starting a new data project can be overwhelming. But don’t worry, with my 20 years of experience, I’m here to guide you through it.

Typically when I start to perform a new data related task or analysis for a project, I have to make sure that I meet the expected objectives, which often include identifying patterns, trends, and insights that can be used to drive business decisions.

10 Point Checklist

Point 1: First things first, you need to understand the nature of the deliverable that’s being asked for. Is it a new report, database table, column, data visualization, calculation, or a change to any of the above? In a similar fashion you also need to understand the technologies in play that you have to work with. This could be anything from Tableau, Power BI, SQL Server, Oracle, Teradata or even Microsoft Access (yes, people still use this tool).

Point 2: It’s crucial to know the desired delivery time frame for your project. You don’t want to end up with a longer timeline than what the project manager or client had in mind. Communication is key in this situation.

Point 3: Who is the intended audience for this deliverable? If it’s for an executive audience, you may need to roll the numbers up and take out some detail. If it’s for an analyst or operational audience, you may want to leave in more detail.

Point 4: How much historical data is required? What is the anticipated volume of data that your deliverable is going to generate? Don’t get caught in a situation where your solution can’t handle the trending analyses for a 2 year time frame when you only pulled data for the last 6 months.

Point 5: Understand the volume of data that your solution will generate. For example, a 5 million row output is not conducive to a 100% Excel approach. You will definitely be in the land of database analyses. However you may later present the data at an aggregated level (see point 3) via Excel but hopefully using a real data visualization tool .

Point 6: You need to understand if there’s any Personally Identifiable Information (PII) or sensitive data that you need to access in order to carry out the request. This could include social security numbers, passport numbers, driver’s license numbers, or credit card numbers.

Point 7: It’s important to understand the business processes behind the request. As data people, we tend to focus only on the data piece of the puzzle, but understanding more about the relevant business process can help you deliver the better results for your end users.

Point 8: Try to find and understand any relevant KPIs associated with the business processes on which your data project/task is affecting.

Point 9: Perform data profiling on your datasets! This can’t be stated enough. Profiling leads to understanding data quality issues and can help lead you to the source of the issues so they can be stopped.

Here are a few data profiling videos I’ve created over the years to give you a sense of data profiling in action.

Point 10: Understand how your solution will impact existing business process. By changing a column or calculation, how does this impact upstream or downstream processes? Keep your email inbox clean of those headache emails that are going to ask why the data looks different than it did last week. Most likely there was not a clear communication strategy to inform everyone of the impact of your changes.

Bonus Considerations:

Here are a few bonus considerations since you had the good fortune of reading this blog post and not just stopping at the video.

Bonus Point 1: Consider any external factors that could impact your data project. For example, changes in regulations can impact the data that you collect, analyze, and use. If the government imposes stricter regulations on data privacy (see point 6 above), you may need to change your data sources or analysis methods to comply with these regulations.

Bonus Point 2: Consider internal organizational politics when starting on a project. If you work in a toxic or siloed organization (it happens), access to data can be a challenge. For example, if the marketing department controls customer data, accessing that data for a sales analysis project may be challenging due to internal strife and/or unnecessary burdensome roadblocks.

Internal politics can also lead to potential conflicts of interest, such as when stakeholders have different goals or agendas. For example, if your data analyses could impact a department’s budget, that department may have an incentive to influence your work outcome to their advantage (or try to discredit you or your work by any means necessary).

Bonus Point 3: Finally, make sure to document everything. This includes the business requirements, technical requirements, saved emails, and any changes that were made along the way.

When I started my first office position as an intern at a well known Fortune 500 company, my mentor told me the first rule of corporate life was to C.Y.A. I’m sure you know what that means to cover. Having solid documentation of your work and an email trail for decisions made along the way can keep you out of hot water.

Conclusion

And there you have it, my 10-point checklist for starting a new data project. By following these steps, you’ll be well on your way to delivering high-quality results. Don’t forget to like and subscribe for more data-related content!

I appreciate everyone who has supported this blog and my YouTube channel via merch. Please check out the logo shop here.

Stay in contact with me through my various social media presences.

Keep doing great things with your data!

Anthony B. Smoak

Advertisement

How I Passed the Tableau Certified Data Analyst Exam

I’m proud to announce that I recently passed the Tableau Certified Data Analyst certification. If you found this article, most likely you are looking for a perspective on the exam and how to pass and earn this certification yourself. Here is the story of my journey, which may differ from the typical experience.

I had a New Year’s resolution to add the Tableau Certified Data Analyst certification to my resume because the Tableau Desktop Certified Associate certification I held was due to expire.  If you want to read up on how I passed that older exam, you can find my insights here. Some of those insights will also serve you well on passing the current exam.

I believe that certification has its advantages. It’s a way to signal to potential and current employers that you have some defined level of competency in a targeted skill. It’s also a means to strengthen the case to your employer that you deserve additional compensation (if you are under-compensated). Fortunately, I am compensated fairly now, but this has not always been the case (shout-out to highly competent middle office IT pros toiling away underappreciated, but I digress). Finally, studying allows you to stay up-to-date on the latest tools and trends in your chosen domain.

How Much Experience Do You Need?

The official exam guide states, “The best preparation is role experience and time with the product. To be prepared, candidates are strongly encouraged to have at least 6 months of experience.” I would tend to agree with this if you have used the tool extensively during this time frame. Otherwise, I would recommend at least 1 to 2 years experience with the tool and as a data analyst before attempting to sit for this one. Focus on obtaining the Tableau Specialist certification (it never expires) first before attempting this exam.

Why Did I Get Certified?

For my purposes as a senior manager in a consulting practice, certification certainly has benefits with respect to establishing credibility quickly on new projects. I may hold a manager title but you’ll never pry my hands away from keyboard-centric hands-on technical work, as I enjoy being a technical subject matter expert (and teaching/mentoring others).

Other than employment and signaling purposes, an additional benefit of certification is the personal growth and esteem benefits that you gain from tackling a goal. My body of work is visible online and I have years of relevant experience, thus certification is not something I necessarily needed but something I desired.

The main difference between the new Certified Data Analyst exam and the older Desktop Certified Associate exam is that you will now be tested on Tableau Prep, Tableau Server and Tableau Online. Having to understand aspects of Server and Online were initial concerns I held before taking this test.

I have about 7 years of experience between Tableau Public & Desktop and about a year of experience with Tableau Prep so that was not an issue. I have used Tableau Server to publish my dashboards while on a project at a large Fortune 500 company, but I would by no means consider myself a server expert. I’ve used Prep to transform data for clients without issue as it is easy to pick up with exposure and usage. Look at this listing of domain items covered on the exam.

My strategy to compensate for a lack of deep hands on experience in Domain 4 was to perform really well on all the other domains. Using this strategy, I could still potentially score 91% max (assuming I miss every Domain 4 question which would be highly improbable). If you are like me and have deep knowledge of Tableau Desktop, then you should be fine. Do not use a lack of server experience as an excuse to avoid certification. Simply read up on publishing content at these links and you should have a fighting chance. Personally, I found the Certified Data Analyst exam to be somewhat easier than the Desktop Certified Associate exam. Not easy, just a little bit easier with respect to the Tableau Desktop asks.

This Tableau Prep link could prove useful as well:

Another difference between the Certified Data Analyst exam and the older Desktop Certified Associate exam is the presence of a hands-on lab portion. I honestly found this to be the easiest section on the test, although your mileage may vary. There was one question that had me stumped only because I wasn’t sure what was being asked so I built a visual that probably did not reflect the ask. Other than that 1 question, I felt that I nailed this section.

The official exam guide states, “Candidates are encouraged to comment on items in the exam. Feedback from all comments is considered when item performance is reviewed prior to the release of new versions of exam content.” In hindsight, I should have left a comment on the question stating “unclear”.

For the hands on lab (I’m not sharing anything that isn’t already on the exam guide), definitely be familiar with filter and highlight actions, how to use a TOP N filter, how to use parameters with filters, labels, and how to add reference lines and perform custom sorting.

How Did I Prepare?

Honestly, I meant to prepare for at least a week beforehand, but life got in the way. Thus, I literally crammed my review into the span of 7 hours the Saturday before sitting the exam. I do not recommend this if you are not well versed in the tool. I simply needed to review some concepts. The listing at this website provides great links to official Tableau documentation for the subject areas covered on the exam.

Results

I completed the exam with about 35 minutes to spare. After I submitted my results online, I only had to wait an hour before I received an email stating that I had a score available. This is in stark contrast to when the beta exam was in effect. I heard that results would take months to process. I cleared the 75% hurdle despite studying for only a few hours and not having deep experience with Tableau server. I could have easily scored higher given more study time, but I was happy to pass the exam given the meager study time I allotted to the task. I’m not saying that the test was easy, I’m just fortunate that I’ve had enough experience with Desktop that I could “sacrifice” in other areas and still make it across the finish line. This strategy may not work for you if you have under a year’s experience with the tool.

Focus on These Subject Areas:

However, here is the section you came for, this is my abridged list of test focus areas. Make sure to focus on these subject areas to give yourself a good shot at passing the exam.

Start here: Here are 5 useful videos from my catalog that you should review to level up for the exam. I promise they are worth your time and will help you prepare. Do me a favor and like the videos to help others find the content as well!

I used this link to acquire access to a free practice exam: https://savvy-data-science.ck.page/1ec0f2d5a8

Additionally focus on these areas from the exam study guide:

  • INDEX function
  • Parameters
  • TOP N Filter
  • Context Filters / Data Source Filters
  • DENSERANK
  • Exporting Options
  • Sets
  • Extracts
  • DATETRUNC, DATEPART, DATENAME
  • Map Density
  • Percent Difference
  • Know How to Interpret a Box-Plot
  • Know How to Build Dual Axis Charts
  • Understand FIXED LODs
  • Understand TOTAL vs SUM
  • Understand Hierarchies
  • Understand Show Hide Container Functionality
  • Design for Mobile Layouts
  • Blending Data
  • Know How to Add Totals to Charts
  • SPLIT Function
  • Row Level Shading

Also follow Jared Flores as he has a great YouTube channel focused on Tableau Prep.

Best of luck to you. I know that you can pass this test if you have decent hands on experience with the tool. For those of you without a Tableau license, use Tableau Public to study and fill in gaps by reading blogs, watching videos and using Tableau official documentation. I believe in you!

Need Personal Data Tutoring?

Are you a beginner that needs help understanding data topics in Tableau (or Excel/SQL) and would like someone with experience to discuss your problem? If so, contact me here to schedule a 1 on 1 virtual meetup. Make sure to describe the concept that you are trying to learn in the message so I can understand if I can help. Depending upon your ask and time required we can discuss cost. Access to Tableau Public will cover most of your study needs regarding the Tableau Desktop sections and lucky for you, that is a FREE tool.

About Me (Data background):

  • Experience: 15 Years Industry + 8 Years Analytics Consulting
  • Tableau Certified Data Analyst
  • 2X Tableau Ambassador
  • MBA – Georgia Institute of Technology
  • M.S. Information Management – Syracuse University
  • B.S. Computer Science – Clark Atlanta University
  • Certified Business Intelligence Professional
  • YouTube 2.5 Million Views on my Analytics Channel

Image :@anthonysmoakdata (Instagram)

All views and opinions are solely my own and do not necessarily reflect those of my employer

I appreciate everyone who has supported this blog and my YouTube channel via merch. Please check out the logo shop here.

Thank you!!

Anthony B Smoak

How to Become a Data Analyst

I’ve been working with data for some 20 plus years as of the writing of this post. In the video below I captured my thoughts on the required hard and soft skills it takes to succeed as a data analyst. If you are looking to start your career in data as someone who has not yet graduated or as someone with tangential work experience, then this video will serve you well.

Do You Need a Computer Science Degree to be a Data Analyst?

This question is frequently asked by people such as yourself looking to make a move into data. The answer is no. You do not need a computer science degree to have a very successful data career. In the video I give my thoughts on computer science, but the reality is that although it may be helpful from a “getting a first job” perspective, it is not a requirement to succeed. Although I have an undergraduate computer science degree from Clark Atlanta University (shout-out to HBCU alums), some of the brightest minds I’ve worked with in the data space do not have a computer science degree. Bottom line; a formal computer science degree certainly helps but it is by no means necessary. All you need is the willingness to learn the tools and the perseverance to get your first data opportunity.

Do You Need a Computer Science Degree for a Data Career?

Hard Skills Required (View Video)

I’ll give you a hint, data visualization skills are a must and Tableau is the tool of choice for me.

Soft Skills Required

I’ll keep it short here and simply state that you should always look for ways to differentiate yourself and not just be seen as an interchangeable commodity worker. To paraphrase famed Harvard professor Michael Porter, a differentiation strategy advocates that a business must offer products or services that are valuable and unique to buyers above and beyond a low price. In this metaphor, think of yourself as a business and you bring multiple skill sets to your employer (other than being a single focus technical employee who can be easily outsourced for a lower price).

To be a differentiator, do not think of yourself as just being a tool specific analyst. Learn how to take requirements, communicate well, develop exceptional writing skills for business emails and documentation. Finally, learn how to present your analyses to people several pay grades above yourself when required. You want differentiation to be your competitive advantage. You do not want “low cost” to be your advantage for obvious reasons (if you’re like me, you want to be paid fairly for the value you provide).

Future Career Paths

In our jobs we desire mastery, autonomy and purpose. After a certain point in your career you may want to take a leap from the descriptive analytics path and move towards a predictive analytics path. Descriptive analytics (think data analyst or traditional business intelligence reporting analyst) deal with what has happened in the past while predictive analytics focus on what will most likely happen in the future. In order to level up in predictive analytics, you will need python, statistics, probability, and/or machine learning skills.

If you want to make the leap from data into management, you can consider obtaining an MBA or a masters degree in Management Information Systems. I happen to have an MBA from the Georgia Institute of Technology and a masters degree in Information Management from Syracuse. This may seem like a bit of overkill but I work in consulting where credentials are overly appreciated by clients (and I am a lifelong learner).

Interact with my Tableau resume here.

Conclusion

A career in data can be fun (in the early learning phases) and lucrative (mid to late career). In my case it has been a fulfilling career ever since I started work as a data analyst at General Motors many years ago. I turned myself from a commodity to a differentiator by not only learning the basics but also adding business understanding and a willingness to share what I know on this blog and my YouTube channel. I know that you can do the same. If you put in the time to learn along with the perseverance to land that first data role, you won’t need much luck at all to accomplish your goals.

Looking to land that first role or trying to move ahead in your current role? Then check out this post for the Keys for a Successful Career as a Data Analyst.

-Anthony Smoak

All views and opinions are solely my own and do not necessarily reflect those of my employer

I appreciate everyone who has supported this blog and my YouTube channel via merch. Please click here

Thank you!!

Keys for a Successful Career as a Data Analyst

Congratulations, you have just started working as a data analyst in a corporate environment. You think that hard work and performance are enough to get noticed for promotions and salary increases. Well, this is not the case. In this post I am happy to share some knowledge with you that I have painstakingly gained as a career data professional that will help you succeed. It is the kind of advice I wish I had when I started my first job out of college. In actuality, this advice can be tweaked by anyone trying to navigate corporate America. The reality is that hard work and technical acumen are important, but they need to be supplemented. Here are some keys to the game.

Be aware of the P.I.E Theory as coined by Harvey Coleman. Make sure to perform exceptionally well (10%), cultivate the proper image (30%) and manage exposure so the right people will know who you are (60%).

Focus and become an expert in your area of interest. Learn the technical skills required to solve problems others cannot. Do not just be “good enough” to not lose your job. Be exceptional! As companies cut back on training programs, you must close the training gap on your own time.

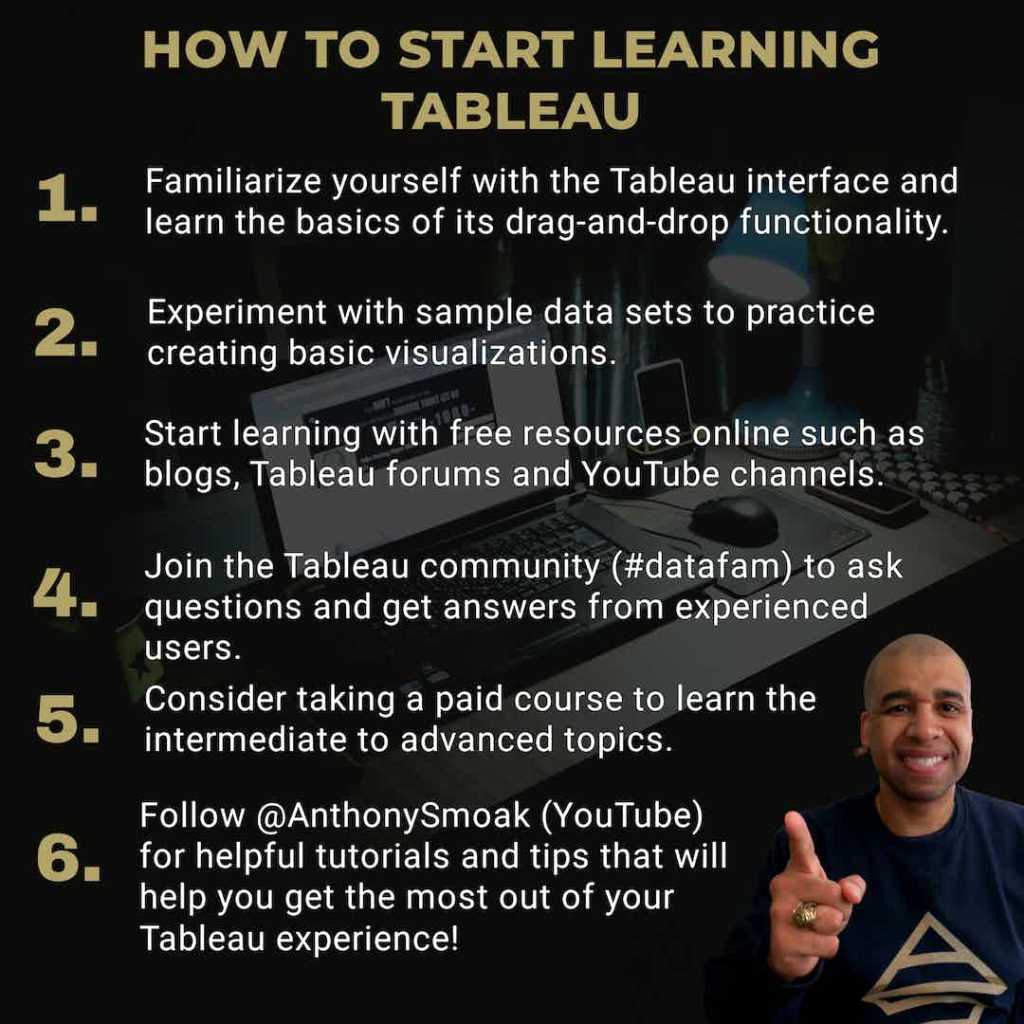
Learn from “Virtual Mentors” online. The internet and more specifically YouTube can be a true Library of Alexandria when it comes to technical resources.

Show what you know. As you learn and gain new experiences, share your knowledge with an online audience and promote yourself. Not in an obnoxious “smarter than thou” way, but in a way that is sincere in helping others. If you produce high quality content, you will get noticed and opportunities will follow.

Build a reputation. In the words of industrialist Henry J. Kaiser, “When your work speaks for itself, don’t interrupt.”

Be Aware of the P.I.E Theory as Coined by Harvey Coleman

  • Perform exceptionally well (10%)
  • Cultivate the proper image (30%)
  • Manage exposure so the right people will know who you are (60%)

I first learned of Harvey Coleman’s P.I.E. Theory while working on my MBA at the Georgia Institute of Technology Scheller School of Business. As a pure technical computer science undergrad, the political and organizational rules for success were not apparent to me.

Mr. Coleman in his book “Empowering Yourself: The Organizational Game Revealed” assigns a weight to each one of the principles that indicates its impact on long term success. One would think that performance would constitute most of the weight, but curiously it does not. Performance is simply the price of admission, table stakes and the minimum expectation for employment. If you are not performing, your image and exposure will not help you (unless you are royalty or your last name matches the owner of the company). Nothing else matters if you are not good at your job.

Image at 30% has three times the weight as performance with respect to climbing the ladder. It serves as an important tiebreaker amongst a high performing candidate pool. Image can consist of the clothes you wear, your demeanor, your manner of speaking, ability to be a team player, etc.

Be aware that you are sending signals at all times of your appropriateness for success at the next level. If you are a hoodie and jeans diehard while the next level is sport coats and slacks, you may want a fashion makeover if you have higher aspirations.

Exposure will have the greatest impact on your career at 60%. You cannot ascend on your own. Someone at the next level or higher (i.e., sponsor) will have to champion you for a disruptive career enhancing move. The risk to the sponsor is having to explain to others at their level why they championed an unqualified individual, which can reflect poorly on their judgement.

You can minimize your would-be sponsor’s risk by volunteering for internal projects, assuming more responsibility within your job role, being a team player and learning new skills. Make your manager feel comfortable advocating on your behalf when she is speaking with the other power players in your organization.

Focus and Become an Expert in your Area

We look to experts to solve our problems and provide advice within certain domains. If we have vision problems, we might seek advice from an optometrist, not necessarily an auto mechanic. The same dynamic is in play when we look for people within an organization to solve a particular problem.

If you have a reputation as one of the few SQL experts or Tableau experts (or any other in-demand skill) that can relieve specific pain points, then you will increase your reputation. People will begin to seek you out for assistance in solving their problems which enhances your image and can lead to the proper exposure.

Data analyst appropriate technical skills include knowledge of database languages such as SQL, R, and Python. Let me emphasize that you MUST learn SQL if you consider yourself a data professional. Master Microsoft Excel because it is not going anywhere anytime soon. When the next 50 mile wide asteroid impacts Earth, the only things left will be crocodiles and spreadsheets.

Sometimes all a company has for “reporting” tools is the basic combination of Excel and PowerPoint. Therefore you better be ready to pivot, VLOOKUP and write customized VBA functions at a minimum. Sometimes we go to war with the tools we have, not the tools we might want or wish to have at a later time, to paraphrase a former government official.

Learn data visualization software such as Tableau (solid visuals and strong community), Power BI (Microsoft stack) or Qlik (data load scripting). It does not matter if your organization uses the tools or not. Learn them now and use them later to solve problems in a novel way that your peers may not consider. All three tools have free versions that are available for experimentation.

Other useful data analyst skills include Alteryx, SAS and statistical skills. As a data analyst your role is to help gather, organize, analyze and report data. Deep expertise will help you stand out from others and build your internal reputation.

Learn tools and skills even if you do not currently use them in your role. When I first started learning Tableau I was turned down for opportunities because I did not have any Tableau project experience on my resume. I made it a point to skill myself up on nights and weekends and combined that effort with visible displays of credibility (my blog and YouTube channel).

I learned basic Tableau skills using Tableau Public because I did not have a current Tableau license at the time! Now that I have acquired recognition as a Tableau authority, opportunities come to me from within and outside my organization without me explicitly seeking them out.

Do not just be “good enough” to not lose your job. Be exceptional! If that means learning skills on nights and weekends, commit yourself to that goal. Learn as much as you can as fast as you can to make an impact.

In Michael Porter style parlance, you want differentiation to be your competitive advantage. You do not want “low cost” to be your differentiator, at least not for a substantial period of time.

Find “Virtual” Mentorship

There is always someone or a group of people that we admire for their proficiency at a given skill. When I started work on my first job, I had a wonderful manager who took me under his wing and taught me the technical skills I needed to succeed at the job. Shoutout to John Jarosinski!

Sometimes we are not lucky enough to establish personal connections and mentorship at the same time. However, thanks to the internet we can follow experts online. When I decided to start learning Tableau, I learned much from Andy Kriebel. I have never met the man, but I count him as a virtual mentor in learning the Tableau game. As my proficiency increased, I followed others in the Tableau community like Luke Stanke, the Flerlage Twins, Ryan Sleeper and Lindsay Betzendahl.

On the Power BI side of the house consider Guys in A Cube, Sam McKay, Ruth Pozuelo Martinez, Parker Stevens and Spencer Baucke (who is also excellent in Tableau). For Qlikview I seek out Udemy classes by Shilpan Patel. Excel standouts include Leila Gharani and Oz du Soleil.

The internet and more specifically YouTube can be a true Library of Alexandria when it comes to technical resources. Learn what you can and support creators through their paid online classes and merch when available!

The reality is that you will need to learn more and more on your own as companies have pared back on generous training programs for this generation of workers. A number of organizations believe that training dollars are wasted on employees who will simply jump to the next company after they have received training. If you work for one of these companies, you will need to skill yourself up on your own time to standout.

Show What You Know (Promote Yourself)

In past roles, I performed well but outside of my specialized cohort, no one knew. As typical with data roles, if reports were generated on time, there was no issue. If there were interruptions, then everyone suddenly took notice. Don’t remain underappreciated!

One of my talented ex-co-workers who I still consider a friend started publishing and sharing what he knew online for others to consume. He developed training courses and started posting articles regularly on LinkedIn. He is a humble person but highly skilled. His self-promotion activities were not vanity endeavors, he genuinely wanted to help people learn.

I noticed that people both inside and outside of the organization took notice and his star began to rise (he was a high performer as well). He was able to leverage his performance and the subsequent image and exposure boost to obtain a significant raise. He eventually moved on from the organization into another organization with a greater increase in salary. The reputation he built from performing at a high level AND establishing visible displays of credibility online smoothed the path for his transition to greener organizational pastures.

Meanwhile I was underpaid and underappreciated, yet diligently performing my tasks. As the saying goes, “If you don’t have your own plan, you will fall into someone else’s plan.” I’ll add, “You may not like the alternate plan.”

From that point on, I decided to follow my friend’s blueprint and started publishing what I knew on social media. We all have something to say in our unique voice. There are gems that you know that you take for granted, but others would benefit from that knowledge. So share them!

Start a WordPress blog, post to Medium, LinkedIn or Twitter. Create visualizations on Tableau Public or collaborate on GitHub projects. If you have the discipline and afterwork/weekend time commitment start a YouTube channel!

As you learn and gain new experiences, share your knowledge with an online audience and promote yourself. Not in an obnoxious way, but in a way that is sincere in helping others. If you produce high quality content, you will get noticed and opportunities will follow.

Combine your social media efforts with certifications in your desired area to establish your bona fides.

This is exactly what I did. Today I am in a new organization, I make more financially (greener pastures, pun intended) and have been promoted multiple times. Combined with excellent performance (i.e., table stakes), I picked up recognized business intelligence and Tableau certifications. I also learned visualization skills that helped my manager look successful. I made everyone I could be aware of my new Tableau and visualization skills by leveraging social media to exhibit my passion for data. Thus, I mitigated the risks associated with my manager’s sponsorship.

Currently, my YouTube channel has just under 11 thousand subscribers and 1.4 million views. That’s not a bad subscriber count for a niche data channel. Leverage social proof to your advantage!

If you are searching for your first or next position in data, recruiters (or hiring managers in your current organization) will search for your online body of work. If they cannot find any evidence of your credibility, you are at a disadvantage. When your portfolio of work can be found online, it affords you an advantage against others in the candidate pool. Your reputation speaks for you before your initial conversations.

In Conclusion

Data analysis is a fun and interesting career for those who have the technical chops and dedication to continually better themselves. Technology does not stand still, and minimal training and work effort do not move the needle. Learn as much as you can as fast as you can, earn certifications, promote yourself (this is key) and give your would-be sponsor a reason to advocate for your disruptive career progression.

If you agree or disagree, let me hear it in the comment section.

Do Great Things with Your Data

Anthony B. Smoak

If you are looking for a “Virtual Mentor”, please like and subscribe on the Anthony B. Smoak YouTube channel!
Definitely pick up some merch if you’ve enjoyed this blog and YouTube channel over the years:

All views and opinions are solely my own and do not necessarily reflect those of my employer.

Featured Image by Gerd Altmann from Pixabay

Photo 1 by Anna Nekrashevich from Pexels

Photo 2 by RODNAE Productions from Pexels