The Wait is Over. Watch this Tableau Dashboard Container Layout Video!
This video was a long time coming. If you’ve ever dealt with layout containers in Tableau (which are about as intuitive as a Thomas Pynchon novel) you know they can leave you scratching your head if you’re new to the tool. And yes, I do own a copy of Gravity’s Rainbow.
Luckily for you I was up I was up at 2:30 a.m. on a Sunday recording the second part of my popular Tableau dashboard tutorial, because that’s how passionate (and stubborn) I am about providing you educational videos of value. Quality over Quantity!
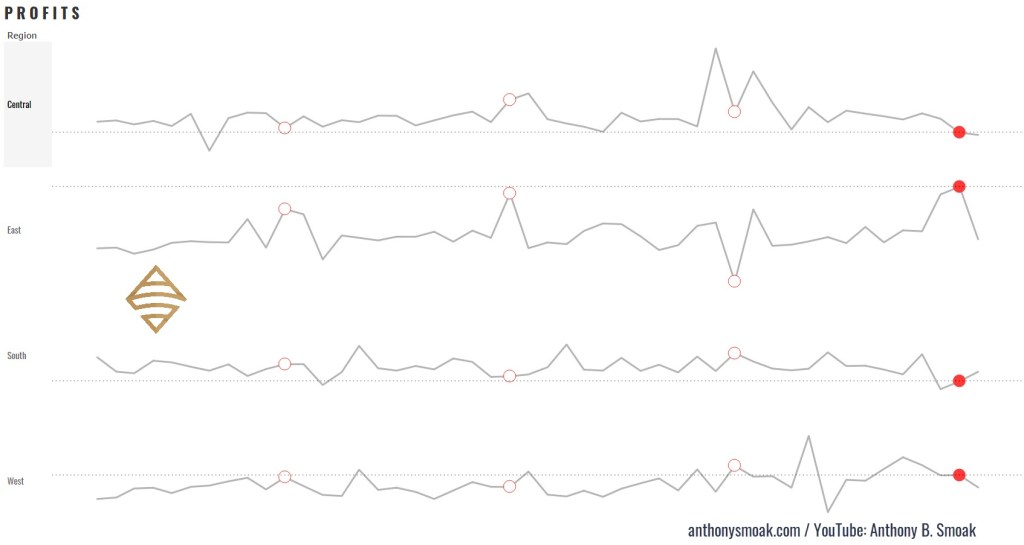
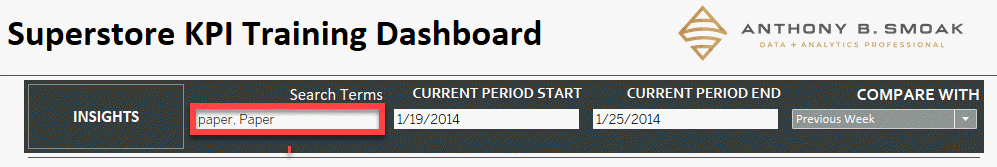
Watch the preview video above, you’ll observe that I’m teaching you a step-by-step breakdown of how I laid out the visual components for an advanced Tableau dashboard using layout containers. This is part two of the series, and while you can absolutely follow along here, the full experience (with all the dashboard elements, charts, and finishing touches) is available to members of my YouTube channel.
I demonstrate a floating container technique that I learned from Curtis Harris’s excellent video on the subject (look up “Things I Know About Tableau Layout Containers” on YouTube).
Before I forget, I want to give a shout out to Dmitry Shirikov, whose original design I reverse engineered and rebuilt (with his permission), and Murilo Cremon for original overall inspiration.
Let’s get into what I actually did.
What You’ll Miss If You Don’t Watch the Full Video
There’s much that you won’t fully grasp until you see it in action in the video. Things like:
- How I embedded a YouTube link in an image element
- The way I sequence container stacking to prevent the annoying TILE factor
- How to work around Tableau’s quirks when resizing and aligning objects
- What I do when Tableau auto-adds objects I don’t want
- And most importantly, how all the complex pieces come together to form a professionally polished dashboard
All of this is explained in detail in the full tutorial video, available to my channel members.
Your Next Steps
If you’ve been struggling with dashboard layouts, or you’ve watched my first Tableau dashboard build and you’ve been waiting forever for part 2, here’s what I recommend:
- Rewatch Part 1 of this tutorial series (it’s free on my channel).
- Follow-along and implement the container techniques I’ve outlined here.
- Consider becoming a member to access the full Part 2 tutorial which clocks in at 45 minutes!
- Download and admire the actual Dashboard from Tableau Public.

Join the Channel, Build Better Dashboards
Becoming a member supports the channel and helps me keep making high-quality Tableau content. Tutorials like this take hours of research, recording, editing, and production. I don’t mind putting in the work because I know how much value it provides (thank you for all your wonderful comments, I read them all) but your support goes a long way.
Thanks for rocking with me all these years; now get out there and do some great things with your data!
-Anthony Smoak
I appreciate everyone who has supported this blog and my YouTube channel.
Stay in contact with me through my various social media presences.