Drilling with Set Actions
If you’ve ever tried to use the default drill functionality within Tableau, you know that it could be a more user friendly experience. The default table drill functionality opens all of the options at the next drill level which can force a user to lose sight of the data upon which they’re focusing. A more user-friendly option enables the user to only drill into a specific selected value where focus and attention can be maintained. This is otherwise known as asymmetric drill down.
Fortunately as of version 2018.3, Tableau has added Set Actions as a new functionality. At a high level, developers can take an existing set and update its values based upon a user’s actions in the visualization. The set can be employed via a calculated field within the visualization, via direct placement in the visualization or on the marks card property.
In lay terms this means empowering a user with more interactivity to impact their analyses.
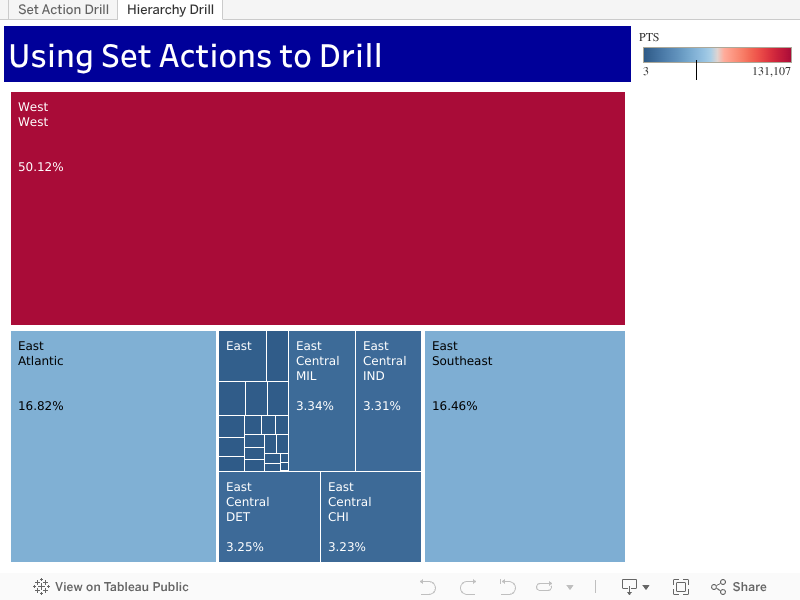
In this first video, I’ll demonstrate a use of set actions on an NBA data set. We’ll drill from Conference to Division to Team to Player. This tip will be easily applicable to your Tableau data. And with the bonus tree-map tip you’ll release your inner Piet Mondrian.
Feel free to interact with the set action example on Tableau Public and then download and dissect the workbook.
Drilling with Level of Detail (LOD) Calculations
If you want to stay with a classic approach, a nice Level of Detail (LOD) workaround can be employed to drill into the next level. Here is a tip that accomplishes a similar outcome where I demonstrate a technique originally presented by Marc Rueter at Tableau Conference 2017.
Now that I’ve equipped you with the knowledge to incorporate customized drilling functionality into your analyses, go forth and do some great things with your data!
References:
https://onlinehelp.tableau.com/current/pro/desktop/en-us/actions_sets.htm
https://www.tableau.com/learn/tutorials/on-demand/set-actions
https://www.basketball-reference.com/leagues/NBA_2018.html
https://www.youtube.com/watch?v=d22A4XVoUEs
Image Copyright dzxy on 123rf.com

Hi Anthony,
I know this is an old post, but it may be newly relevant due to changes in the latest version, 2020.2, of Tableau. Here’s the background.
I’m new to Tableau and my client needed drill-down functionality so your video that I found on YouTube saved me a ton of time. The NBA example was perfect for our needs.
However, although your workbook worked perfectly in 2019.4, it behaves strangely in 2020.2. Namely, when you click on a division, the teams AND all the players display, instead of just the teams. I tried this several times and was able to replicate this type of behavior with my client’s data.
I researched the issue, but didn’t find much. However, I was able to fix it by augmenting your Set Action approach with Parameter Actions. Basically, I set the value of a team parameter when the calculated field “Drill 2 (Team)” is selected and added that parameter to the condition of the calculated field “Drill 3 (Player Name)”. I have no idea why it stopped working in the first place, but this seems reliable.
Thank you very much for your great work and for posting your tips!
Ken
LikeLike
To follow up, I did want to ask a couple of questions. First, are you able to replicate the issue I’m seeing or is it just me? Second, is there a better approach, perhaps leveraging other features of Tableau, that is better than the one I used?
Thanks again!
LikeLike