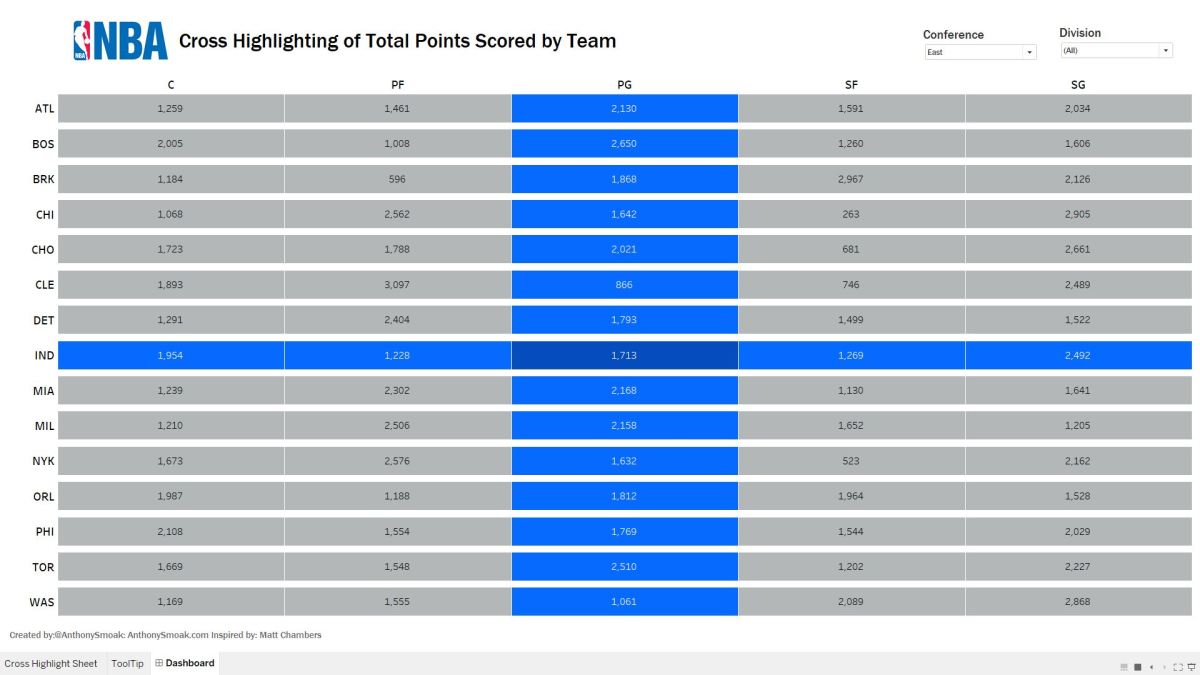
In this post you’ll learn how to highlight values in your Tableau table using set actions. The dashboard in this video displays the number of total points scored by NBA teams by position in the 2017-2018 season. I will give you step by step instructions on how to implement row and column highlighting on this dataset downloaded from basketballreference.com.
I’ve only made a few minor tweaks but this technique was developed by Tableau Zen Master Matt Chambers. You can check out his blog at sirvizalot.com and follow him at @sirvizalot. Big shout out to Matt for sharing this technique with the Tableau community!
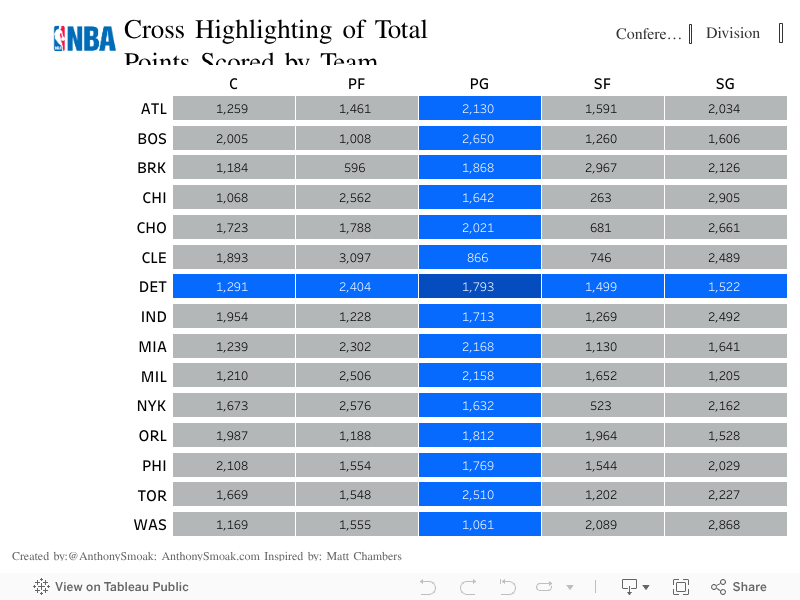
You can interact with my visualization on Tableau Public:
If you find this type of instruction valuable make sure to subscribe to my Youtube channel!
