
I decided to make this video after someone left a comment on another video I made titled “How to Highlight the Top 3 Bar Chart Values in Tableau” asking how to find the last three values.

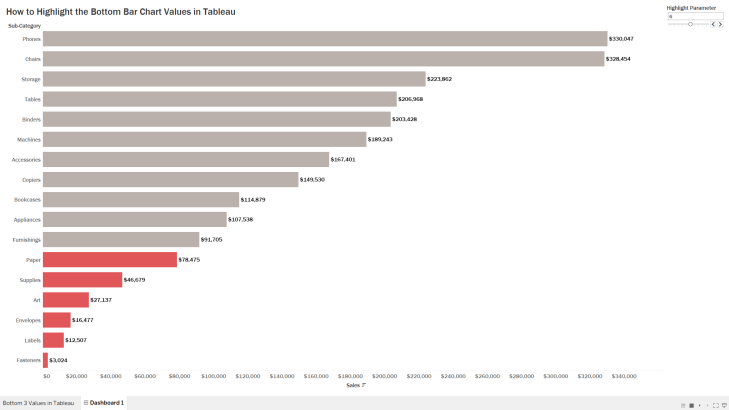
In this video I will show you how to highlight the bottom three sales values on a bar chart. You’ll also learn how to use a parameter to dynamically change the number of lowest bars highlighted.
We can accomplish the highlighting of the bottom N bar chart values via two ways. We can either create a set or create a calculated field to accomplish this task. The set method is cleaner but has its limitations when multiple dimensions are used in the visual. Therefore, the calculated field approach serves us well when we add multiple dimensions.
Watch the video to see how it all comes together but the calculation boils down to this:
RANK(SUM(0-[Sales]))<=[Highlight Parameter]
By adjusting the [Highlight Parameter] control, the user can determine how many bottom sales values are highlighted in the visual. This method also maintains its functionality when an additional dimension is added to the visual.
As always, If you find this type of instruction valuable make sure to subscribe to my Youtube channel.
All views and opinions are solely my own and do NOT necessarily reflect those of my employer.
