
This video is inspired by Filippos Lymperopoulos who has a great article on parameter action concatenation. Definitely check out his article here. I am a hands on person who learns from building and sharing, therefore I put together this video to explore, tweak and hammer home the concept.
In this video we’ll build a Sales Analysis dashboard in Tableau using Parameter Actions and the Concatenation Aggregation functionality. The great thing about this tip is that you can use it across multiple data sources. This is a must see!
This approach relies upon the use of two different data connections. In this manner our data tables are completely un-joined without an established relationship. We have a data-set comprised of a customer list and one comprised of customer transactions across three years.
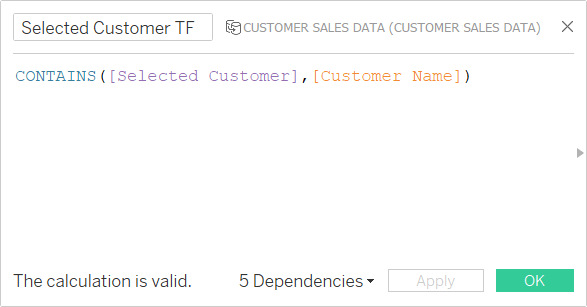
The key to linking the data sets together relies upon the following calculated field which creates a de-facto set that we can use to highlight customer purchases:
When we setup a concatenation parameter action on our dashboard, the very act of selecting a [Customer Name] will add that Customer Name to the parameter named [Selected Customer]. This will cause all selected customers to resolve to TRUE, which allows highlighting of the sales bar charts related to the user selected customers.
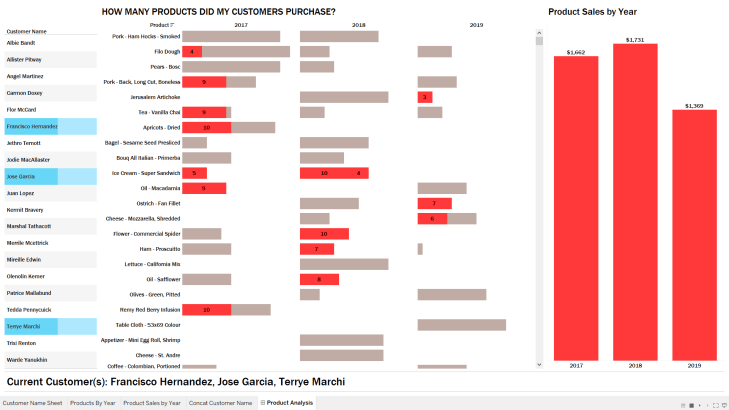
In the screenshot above, notice the selected [Customer Name] values on the left hand side are also concatenated together at the bottom of the dashboard (i.e., Franciso Hernandez, Jose Garcia, and Terrye Marchi). All of their respective purchases are also highlighted in the middle of the dashboard.
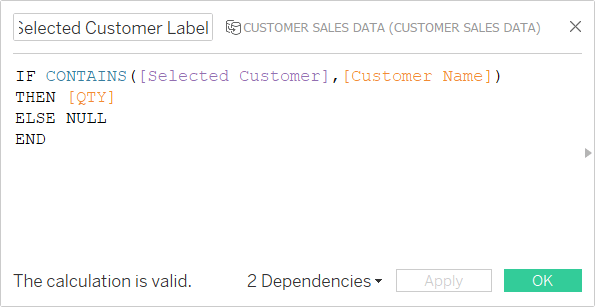
The above calculated field is used to only show the [QTY] purchased for the user selected customer and is placed on the bar chart label.
Feel free to interact with the viz and download the workbook on Tableau Public:
As always, If you find this type of instruction valuable make sure to subscribe to my YouTube channel.
All views and opinions are solely my own and do NOT necessarily reflect those of my employer.
