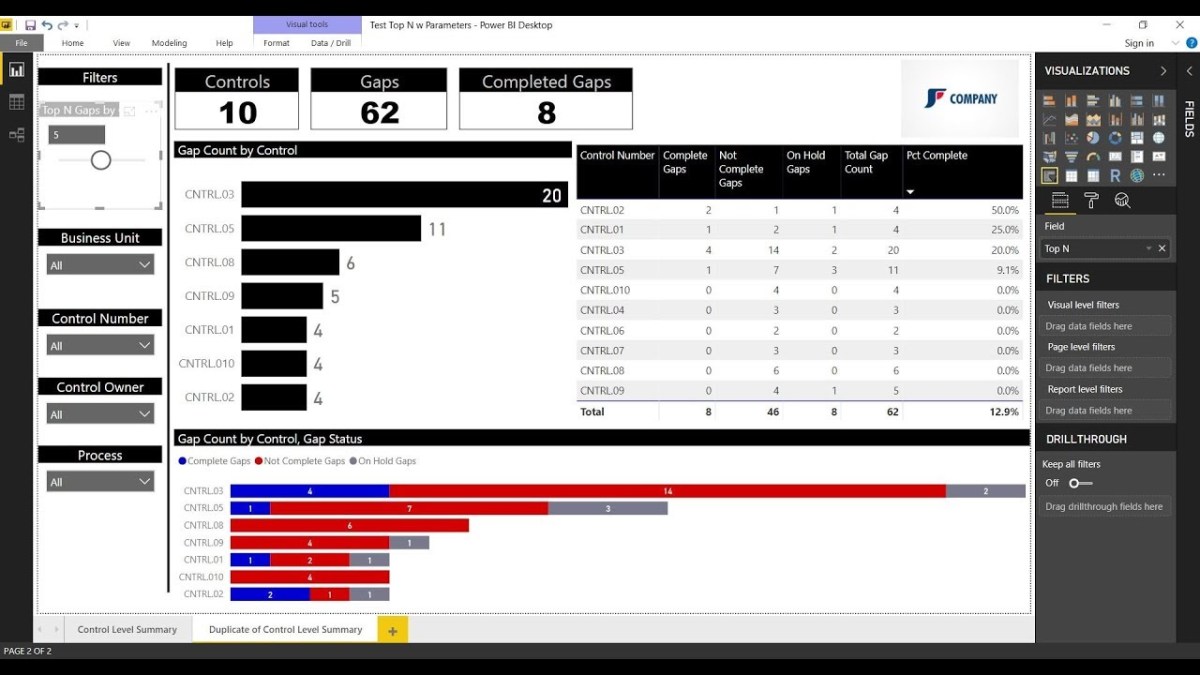
In this video you will learn how to filter the top N values shown in your bar chart visualization using a slicer.
- This technique uses one measure that generates a number 1-10, that will be applied to a slicer.
- Another measure will basically rank all of the values associated with your data bars and only return the values that are less than or equal to the number you select in the slicer.
The comments that I apply to the DAX function should help make it easy to understand. I have to give a shoutout to GilbertQ from the PowerBI community for coming up with the initial approach which I tweaked for the video.
As always, If you find this type of instruction valuable make sure to subscribe to my Youtube channel!

Hi,
I have a set of data where I have various orders by the Selling partners.
I have created a top a TopN for Partners by the dollar amount. Now I have various orders coming through the same Selling partner (let say Partner A)and if I want to apply a slicer on the partner field ( Just to check the top n orders coming from selling partner A), my ranking is completely going out of order.
Can you please help me with this issue
LikeLike
This was very helpful, thanks for sharing Anthony!
LikeLike
Great video! Very helpful – thanks for sharing.
LikeLike
Much appreciated, thanks for the comment!
LikeLike