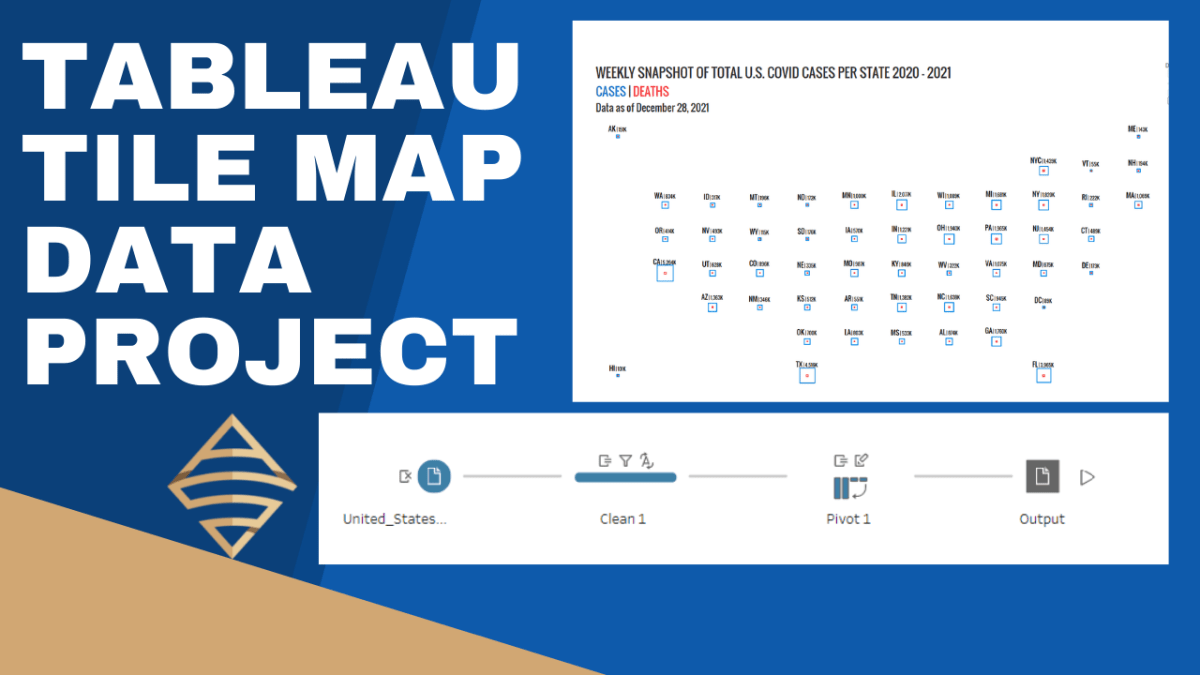
I was recently inspired by some really great tile-maps that have been created in the Tableau community (e.g., see beautiful work by Chimdi Nwosu and Michael Dunphy). Thus, you know I had to come up with a way to construct a simplified map in this style with some data and share with my followers. In these two videos, I’m going to walk you through how to prepare the necessary data file in Tableau Prep Builder and then we’ll build out the tile-map in the second video, step by step.
This is a good intermediate level portfolio project for you to follow along with in order to increase your Tableau Desktop and Tableau Prep skills. We’ll use CDC data, specifically United States COVID-19 Cases and Deaths by State over Time, to build the tile-map.
The advantage of a tile-map is that it represents geographic regions (like states) at equal sizes. Thus, the distortions and biases introduced by differences in sizes are eliminated. In the case of the United States, data for smaller regions like Washington D.C. can be interpreted on equal footing with data for a much larger region like California.
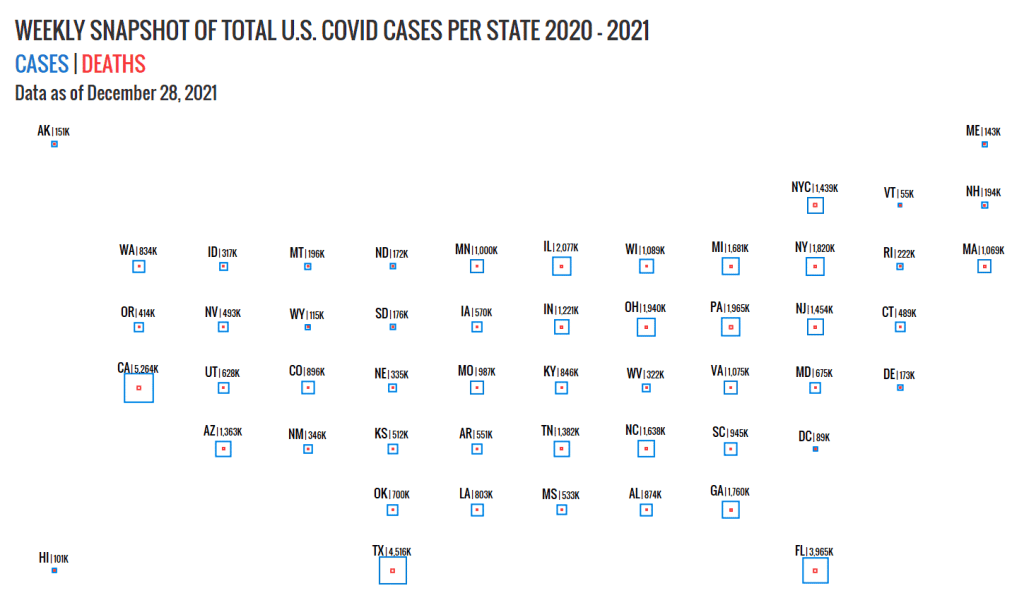
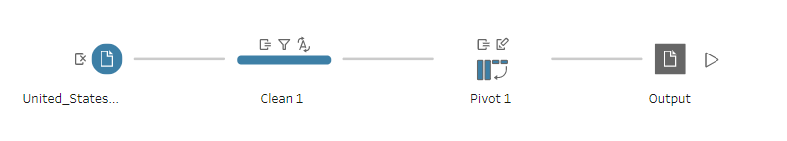
Tableau Prep Builder helps to greatly simply the data shaping process. My only wish is that Tableau would integrate Prep into Tableau Desktop for one seamless data tool to rule them all, but I digress. The process below illustrates how simple it is take some data from an input file, and subsequently clean and pivot the data into a new file. Watch the first video, to learn how to build out this simple flow in Tableau Prep. If you do not have a copy of Tableau Prep, you can complete this lesson on a 14 day trial license of the tool, which you can download here.
Watch the second video for the step by step instructions to build out the tile-map above.
Please like and subscribe on the Anthony B. Smoak YouTube channel.
All views and opinions are solely my own and do not necessarily reflect those of my employer
I appreciate everyone who has supported this blog and my YouTube channel via merch. Please click here
Thank you!!
Anthony B Smoak