In this video we’ll venture outside of the default Power BI TOPN functionality used to isolate the top and bottom N values in a visual. Because you’re an astute follower of my blog and YouTube channel, you want to know more than default functionality. The key to pulling off this feat lies with the RANKX function. By using RANKX to provide a ranking to each row in our data set, we can then determine the TOP and BOTTOM 10 values.
Of course watch the video for further breakdown, but the key to using RANKX effectively in Power BI is to use the ALL function as a parameter. In this way the contents of the entire table are considered for appropriate ranking.
The DESC or ASC parameters will enable the calculation of a rank in either descending or ascending sort order.
And finally the DENSE parameter tells RANKX how ties should be handled in the data. For example if you provide DENSE as a parameter, if 10 values are tied with a rank of 1 then the next value will receive a rank of 2.
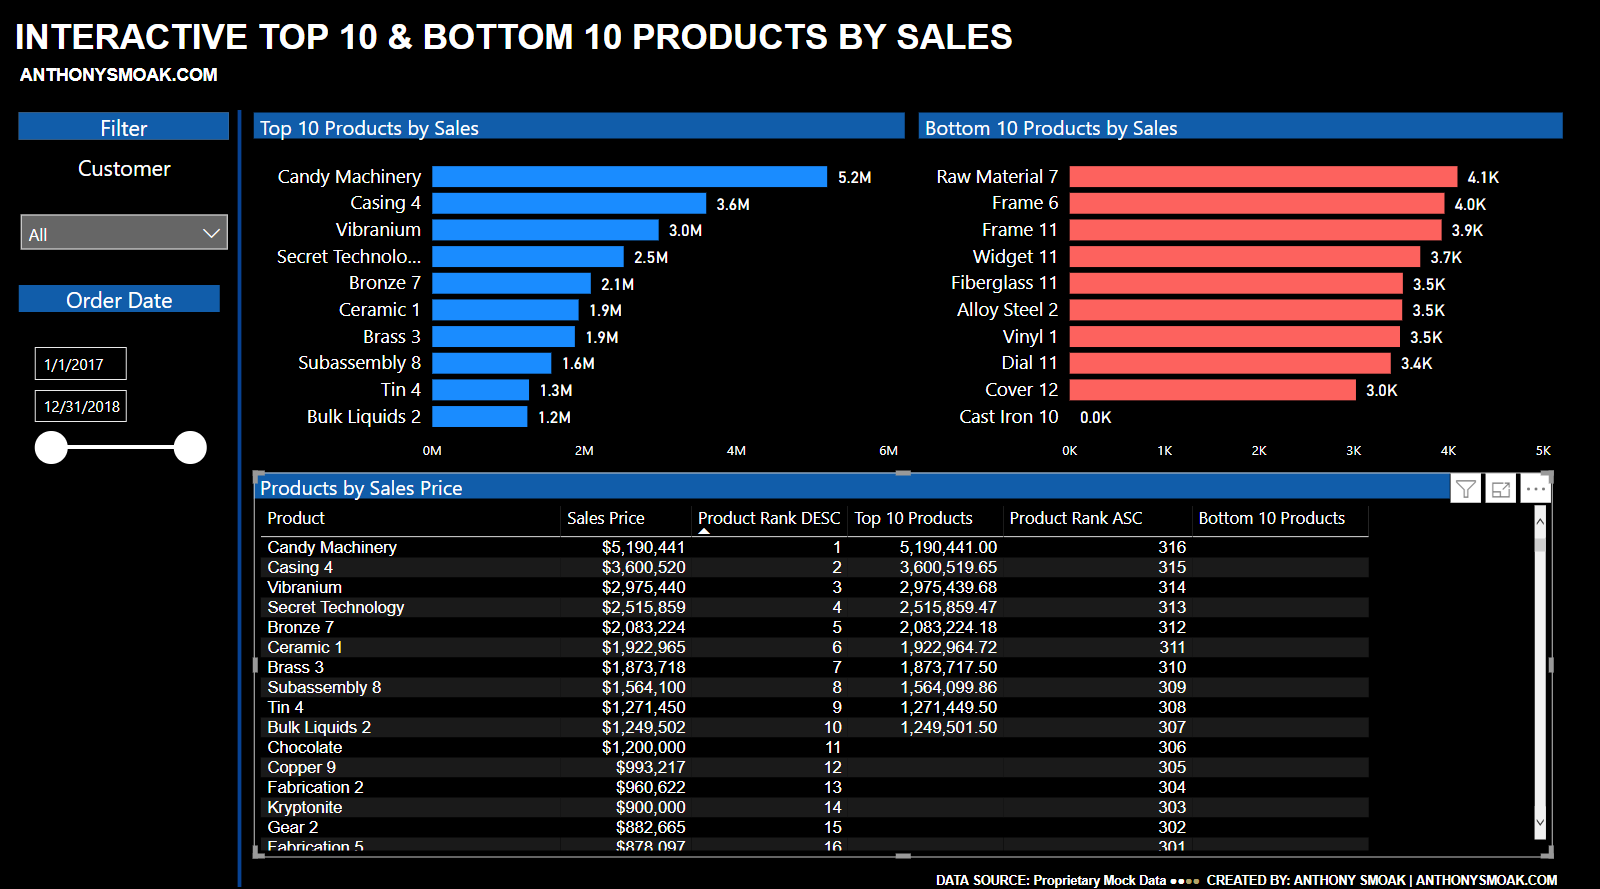
Here is an example use of RANKX that will return a ranking of Sales Price by Product, that ranks the results in descending order (highest Sales receive the lowest ranks) and ties are in contiguous order. Watch the video to determine how to calculate the BOTTOM 10 ranking and to use RANKX to enable the top or bottom 10 values in a visualization.
As a refresher, check out this popular video to build the calendar table referenced in this video: Power BI Dashboard Tutorial: Year over Year Difference Analysis
If you find this type of instruction valuable make sure to subscribe to my Youtube channel.
All views and opinions are solely my own and do NOT necessarily reflect those of my employer.
INCREASE YOUR FOCUS TRY BRAIN.FM
When I am focusing hard during the day at work or developing visualizations on the weekend. I use Brain.fm to help me focus when it matters. It’s Science-driven and research-backed functional music designed from the ground up to help you you focus, relax, meditate and sleep. If you’d like to try a free trial check out https://brain.fm/anthonyb
Please use coupon code anthonyb for a 20% discount upon checkout. It helps support this blog and my YouTube channel as I receive a small commission for purchases made through links in this post.


Do Great Things with Your Data!

[…] Watch Part 1 of this series here: Top and Bottom 10 Products by Sales Using RANKX in Power BI […]
LikeLike
Can you post something on letting the user choose either Top or Bottom, then all of the measures change based on if they want to see top 10 or bottom 10? Also letting them change the N number. So if they want to see top or bottom 14 or 21, they can choose. Thanks!
LikeLiked by 1 person
Thank u so much
LikeLike
Very helpful. How would you make it so that the ‘total’ for the Top 10 only totalled that 10 – here’s it’s showing the same as the total for all the products. Thanks.
LikeLike
I am in desperate need of a tutorial that will show me how, in Power BI, to assign a value based (in a new column) on a date range. Example: If my invoice date is between 2/28/2023 and 4/1/2023, “Period 1”, else if invoice date is between 4/2 and 6/1, “Period 2”, else if . . . . I’ve tried many times and I run into syntax errors and not sure why.
LikeLike
You need the SWITCH function. https://youtu.be/SB8TtXNg7sw
LikeLike