This video represents part two in my Market Basket Analysis series.
The steps in the post were inspired by the book Tableau Unlimited written by former co-worker of mine, Chandraish Sinha. I wasn’t planning to construct another market basket analysis video but when I saw the approach outlined in his book, I felt like it warranted sharing with my readers and followers.
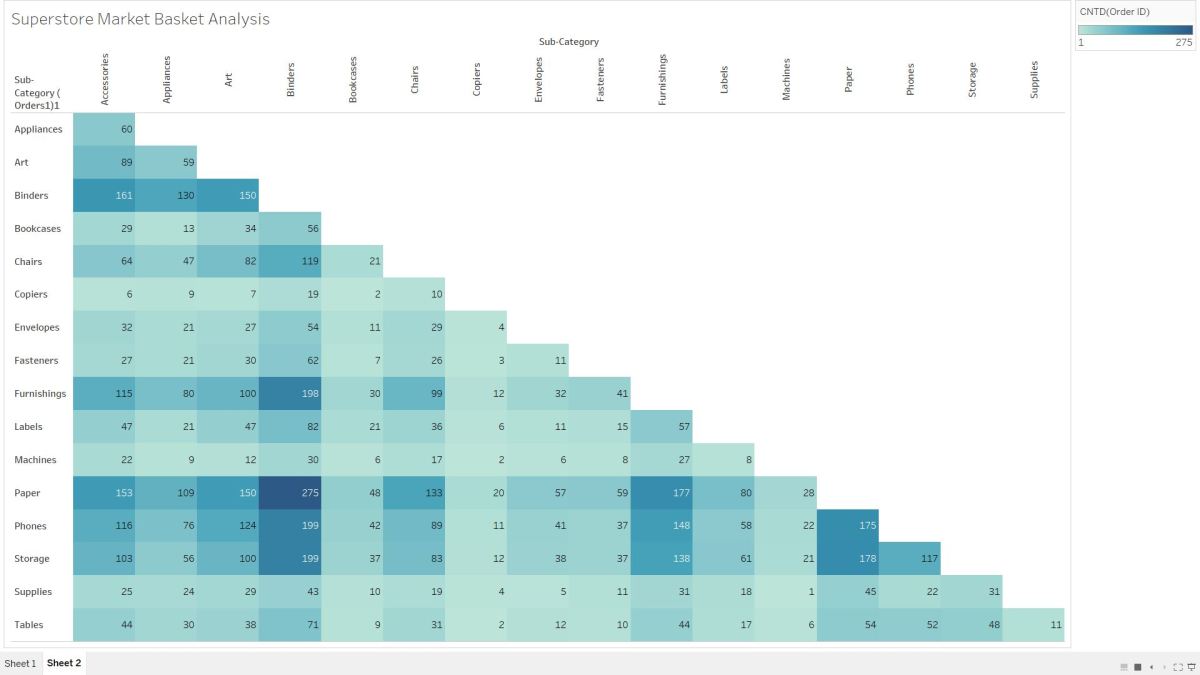
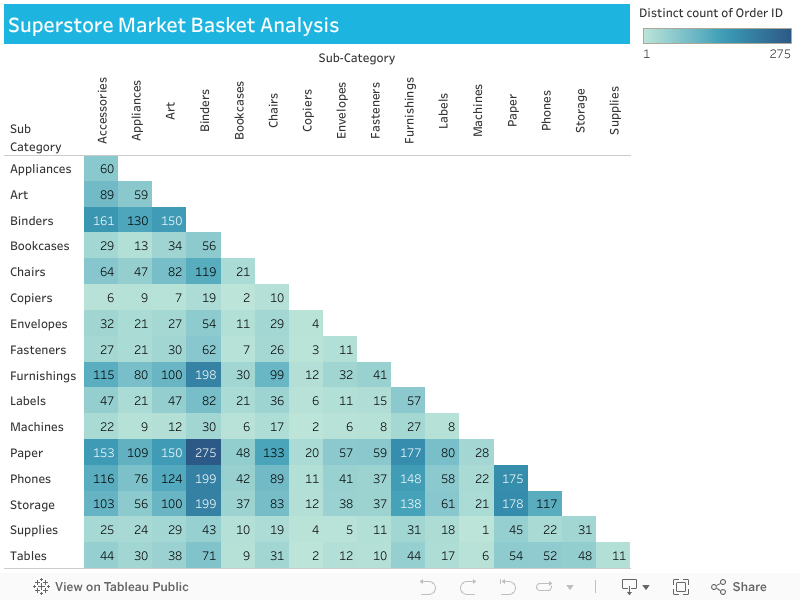
In this version we’ll use default Tableau Superstore data to show the relationship between sub-categories on an Order; all without using a self table join. The visualization and analysis is driven by a user selection parameter.
Once the user selects a sub-category, the bar chart visualization updates to reflect the number of associated sub-category items on the same order.
Watch the video and as always get out there and do some great things with your data!
Feel free to also check out Part 1 here where we create a simpler correlation matrix version that shows all the sub-category relationships in one visual.