TLDR
Yes I put an AI version of myself on the thumbnail. I obviously “Quantum Leaped” from the future to teach you these Advanced Tableau table skills that you’ll encounter in the accompanying video.

Be warned, this is Highly Advanced Tableau!! In the main video, we’ll explore how to generate advanced tables in Tableau (step by step), complete with multiple chart elements displayed on the same table row. It’s OK, you can click the area below since it leads to a YouTube short.
Intro
As a data enthusiast and Tableau user, I always strive to learn new things, experiment with different techniques and share my knowledge with others. Recently, I came across a visualization by Zainab Ayodimeji that caught my attention. Zainab is a Tableau Ambassador and her work is always top-notch, so I reached out to her and asked if I could reverse engineer one of her vizzes for a video. She was cool with it, so I got to work.
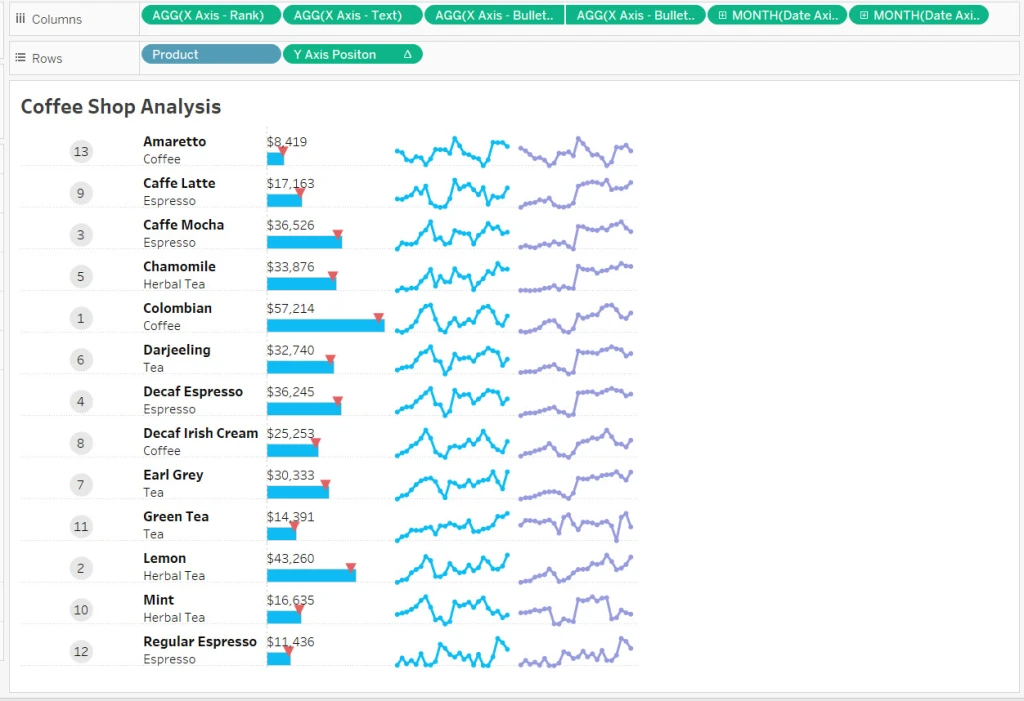
The visualization that caught my eye was an advanced Tableau visualization that used normalized data to create sales and profit sparklines for using standard Superstore data. Zainab’s visualization featured a variety of different chart elements, all on the same row, and looked incredibly cool.
I was immediately intrigued and wanted to see if I could reproduce something similar myself, but with a different data set other than the ubiquitous Superstore. So, I got to work on reverse engineering and came up with my own take on Zainab’s visualization.
I discovered that the technique used in her viz was innovated by Sam Parsons, so I also checked out his video on this technique and found it ingenious; very MacGyver like. Sam’s innovative video is the inspirational source for all of these techniques. Watch his video for the concepts, watch my video for practical hands on building.
Watch the Step by Step Re-creation Video to Learn this Advanced Technique
In the video below, I will explain step by step how I used Tableau to create a compelling chart example that will help my viewers understand the Advanced Tableau calculations and concepts it takes to visualize multiple types of charts on one table row.
The dataset that I worked with contained information about the sales and profits of different products sold at a coffee shop as opposed to Superstore data. Recreating the data with a different dataset forced me to understand the concepts better than just copying and pasting the existing code in Zainab’s visualization.
The Reviews are In

Y-Axis Positioning Trick – (How this Process Works)
One of the coolest concepts in this process is the positioning of the chart elements on the same Y-Axis. Again, a big shoutout to Sam Parsons for coming up with these techniques!
The y-axis position is critical because it determines where each data point will be plotted on the chart. As a result of the ingenious calculation, Tableau places all non-line chart elements at a y-axis position of 0.5, which is the middle of the y-axis. However, for line chart elements, the y-axis position is calculated based on the normalized sales or profits value.
To normalize the data, we make the values of the sales and profit of each product fit between a range of 0 and 1 for a consistent Y axis. This allows us to see the trends of the sales and profits of each product at a standard consistent height on the visual.
The sales or profit axis test (a calculated field) determines whether the normalized sales or profits value should be plotted if the chart element is a line. If the test returns a value of 1, Tableau will plot the normalized sales value. If it returns a value of 0, Tableau will plot the normalized profits value. This is determined by checking whether the sales access product field is present in the detail section of the view.
Download the Workbook for This Technique
Conclusion
I just realized that I used Quantum Leap and MacGyver references in the same blog post (gettin’ Ziggy with it). After watching my video above, you’ll be able to create an insightful visualization using clever and unconventional methods (not unlike MacGyver making a jetpack out of a toothpick and a piece of gum).

Again, big thanks to Zainab and Sam for influencing this work so I could teach you how to Quantum Leap forward in your Tableau skills (Ok I’ll stop with the puns). Keep doing great things with your data!
I appreciate everyone who has supported this blog and my YouTube channel via merch. Please check out the logo shop here.
Stay in contact with me through my various social media presences.
Thank you!!
Anthony B Smoak

