I took the time to produce a dashboard series that would get a relatively new Tableau user up to speed in very little time. I put together the “Goldilocks” videos I wish I had when I was a novice; not too short but long enough to hammer the concepts home.
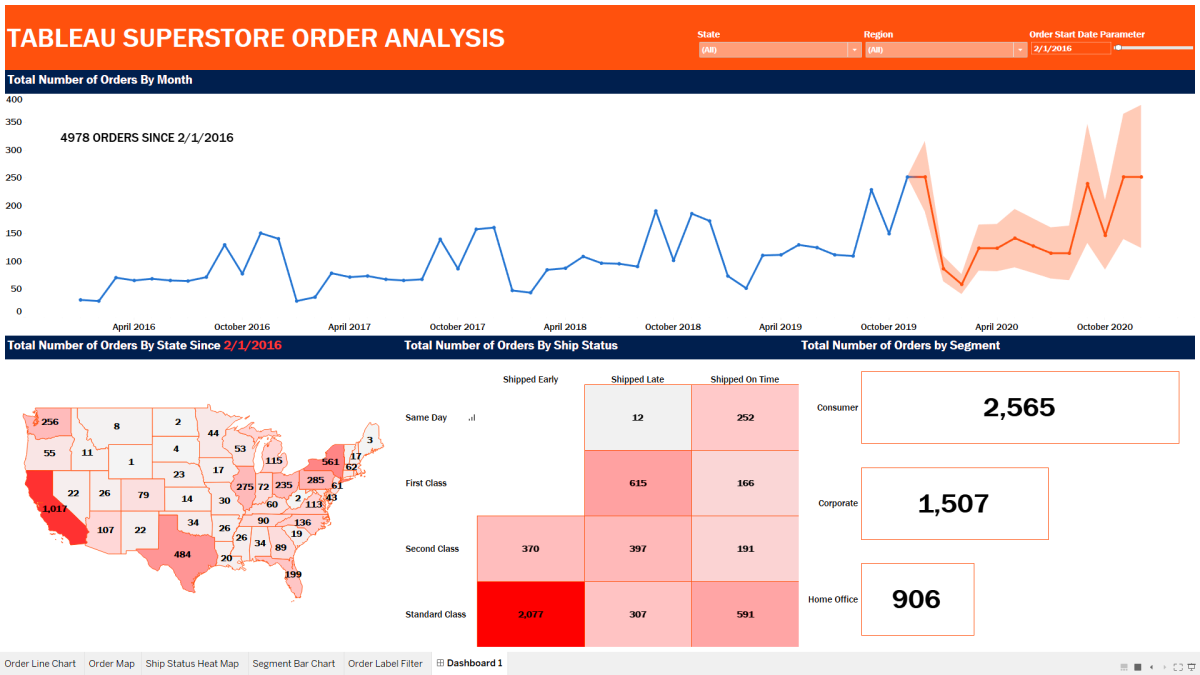
In the first video, I dive head first into constructing four basic charts that I believe every data user should know how to put together. You will watch me demonstrate how to put together the following charts:
Line Chart with Forecast

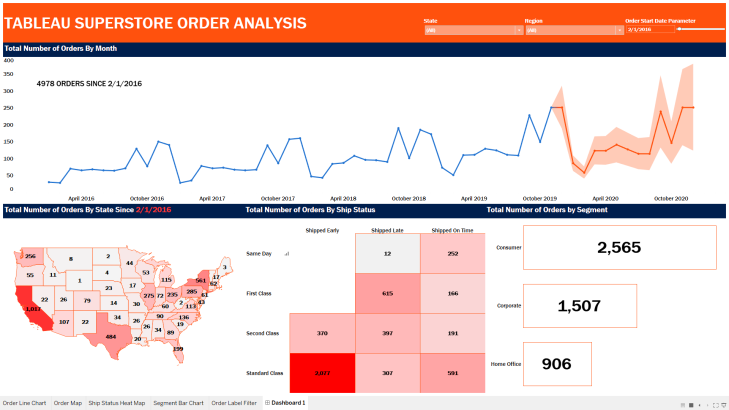
The shaded area is a time series forecast predicting the number of orders for the year 2020.
Map

Heat Map

Bar Chart

In the second video, I’ll cover the layout and formatting of the dashboard, as well as adding a little interactivity. When the user hovers the cursor over the Line Chart, all of the other charts will update to reflect the number of orders represented since the selected month and year.
Full Dashboard

Watch Part 1 to Build the Component Charts
Watch Part 2 for Layout and Interactivity
What You need:
- Either Tableau or Tableau Desktop
- Data set: Tableau Superstore Data (can be found all over the internet with a simple Google search).
Do some great things with your data!
If you find this type of instruction valuable make sure to subscribe to my Youtube channel. All views and opinions are mine alone, independently researched and do not necessarily represent those of my employer.


Extremely helpful in clearing the horizon for me concerning Dashboards. Thanks
Ousmane
Envoyé de mon iPhone
>
LikeLike
Thanks for the comment Ousmane!
LikeLike
Inteeresting read
LikeLike